Sales Reports: 5 Free Templates + Real Examples [2026] 2026
Download 5 free sales report templates for ecommerce. Includes daily, weekly & monthly examples with step-by-step instructions for multichannel sellers.
Download 5 free sales report templates for ecommerce. Includes daily, weekly & monthly examples with step-by-step instructions for multichannel sellers.

A sales report is the single most important document for understanding whether your business is growing or stalling — and if you’re selling across multiple platforms like Shopee, Lazada, Amazon, and your own website, getting a clear picture becomes significantly harder.
This guide covers everything you need to create actionable sales reports in 2026: ready-to-use templates, real examples, and step-by-step instructions. Whether you’re tracking daily performance across marketplaces, analysing which channels generate the most profit, or presenting results to stakeholders, you’ll find practical frameworks to turn fragmented data into clear insights.
A sales report is a document that summarizes your business’s sales activities, performance, and trends over a specific period. It helps you understand how your sales efforts are progressing, whether you’re meeting targets, and where adjustments might be needed.
Sales reports provide a snapshot of key metrics like revenue, units sold, and customer behavior. They are essential for tracking sales performance and making informed decisions to improve strategies.
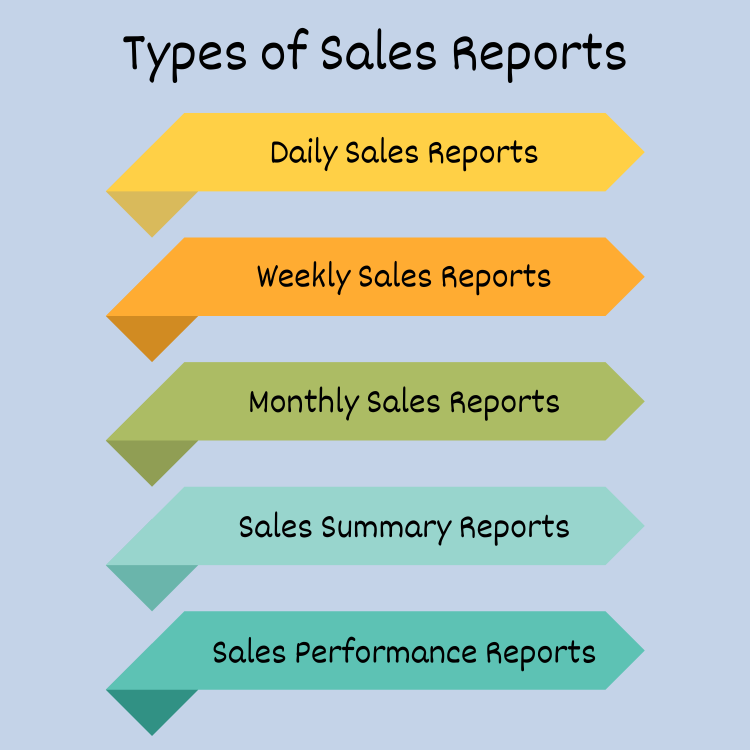
Different sales reports serve different purposes. Here are the most common types:
Each type of report plays a critical role in effective sales management, ensuring that you can adjust your strategies promptly and maximize results.
Sales Reports aren’t just numbers on a page—they’re the foundation for making smarter decisions in your business. By tracking and analyzing sales data, you can uncover trends, measure progress toward goals, and identify areas for improvement.
Here’s why sales reporting is essential:
A well-structured sales report shows whether your team is hitting its targets. It highlights performance against goals, helping you understand where you’re excelling and where you need to make adjustments.
Sales reports reveal patterns in customer purchases, preferences, and buying cycles. By analyzing these trends, you can refine your sales strategy to align with customer needs and drive higher conversions. Learn more about understanding customer behavior in your ecommerce sales funnel.
A product sales report pinpoints which offerings generate the most revenue. This insight allows you to focus on promoting your best-sellers while reevaluating or improving underperforming products.
With sales performance reports, you can track how individual team members or regions are performing. This data helps you to allocate resources effectively and offer coaching or support to your team.
Sales reports don’t just summarise past performance — they help you plan for the future. With detailed insights, you can make informed decisions about inventory, pricing, and marketing strategies. For effective inventory forecasting across channels, see our guide on inventory forecasting. Understanding your gross margin vs gross profit is also critical for interpreting sales report data accurately.
Regularly analysing sales reports allows you to detect emerging trends, seasonal fluctuations, or market opportunities. For Southeast Asian ecommerce sellers, this means tracking platform-specific events like Shopee’s monthly campaigns (9.9, 10.10, 11.11, 12.12), Lazada’s birthday and mid-year sales, and TikTok Shop’s live selling peaks. Acting on these insights — pre-positioning inventory, adjusting pricing, ramping ad spend — can give you a significant competitive edge.
Sales reports provide clear and consistent data for stakeholders, ensuring accountability. They help align teams and leadership on goals, progress, and challenges. A 2024 McKinsey study found that companies with structured, data-driven reporting outperform peers in revenue growth — and the principle applies equally to ecommerce businesses managing multiple sales channels.
In today’s competitive landscape, relying on intuition isn’t enough. Sales reports ensure you’re equipped with the insights needed to optimise performance, increase revenue, and grow your business strategically.
A good sales report isn’t just a collection of numbers—it’s a well-organized summary that provides actionable insights. To create a report that’s easy to understand and drives decision-making, it’s important to include the following key elements:
Every sales report should specify the period it analyzes, whether it’s daily, weekly, monthly, or quarterly. This gives context to the data and ensures comparisons can be made across different time frames.
At its core, a sales report tracks the revenue your business has generated and the total units sold. These are essential metrics that show the overall health of your sales efforts.
Breaking down by individual products or services helps you understand what’s driving revenue. A product sales report highlights your best-performing items and flags underperforming ones for improvement. To better understand optimizing your product listings, check out these 10 tips to boost your product sales.
Segmenting data by region, team, or salesperson provides insights into geographic performance or individual contributions. This is particularly useful for sales performance reports.
Sales KPIs provide deeper insights into sales efficiency. For ecommerce sellers, the most important KPIs go beyond basic conversion rates:
| KPI | What It Measures | Why It Matters |
|---|---|---|
| Average Order Value (AOV) | Revenue ÷ number of orders | Shows whether customers are buying more per transaction |
| Customer Acquisition Cost (CAC) | Total marketing spend ÷ new customers | Reveals true cost of growing your customer base |
| Return Rate | Returned orders ÷ total orders | High returns erode margins — especially on marketplaces with free return policies |
| Gross Margin After Fees | (Revenue − COGS − platform fees) ÷ revenue | The only margin metric that matters for marketplace sellers. Use a COGS calculator to get this right |
| Sell-Through Rate | Units sold ÷ units available | Indicates inventory efficiency — critical for avoiding dead stock |
| Channel Profitability | Net profit per platform after all deductions | Compares Shopee vs Lazada vs Amazon performance on an apples-to-apples basis |
According to Shopify’s guide to ecommerce KPIs, the most successful sellers track 5-7 KPIs maximum per report. More than that creates noise without clarity.
Including the right KPIs ensures your report drives action, not just observation.
Including a section for trends and forecasts helps contextualise past performance and predict future outcomes. For instance, a monthly sales report might compare current performance with the same period last year to spot seasonal trends. Accurate demand planning and forecasting relies heavily on having clean, consistent sales data to work from.
Charts, graphs, and tables make data more accessible. A sales summary report that includes a quick overview of key metrics paired with visuals helps readers grasp the main takeaways at a glance.
For automated data visualization and reporting, see how OneCart’s analytics tools simplify sales management.
This structure includes relevant internal links without overloading the content, guiding readers to additional resources on your site.
While the context of your sales report matters, so does its format. Here are some tips for structuring your report effectively:
Seeing real examples of sales reports can help you understand how to structure your own. Here are several types of reports and what they typically include. Use these as inspiration to create clear and actionable sales reports for your business.
A monthly sales report tracks performance over the course of a month. This type of report is perfect for identifying trends, forecasting future sales, and evaluating whether goals were met.
What to Include:
Example — Multichannel Ecommerce Monthly Report:
| Metric | Shopee SG | Lazada SG | TikTok Shop | Shopify Store | Total |
|---|---|---|---|---|---|
| Revenue | $18,500 | $12,200 | $4,800 | $8,300 | $43,800 |
| Orders | 620 | 385 | 210 | 145 | 1,360 |
| AOV | $29.84 | $31.69 | $22.86 | $57.24 | $32.21 |
| Platform Fees | $2,590 (14%) | $1,708 (14%) | $384 (8%) | $166 (2%) | $4,848 |
| Return Rate | 8.2% | 5.1% | 12.4% | 3.8% | 7.6% |
| Top Product | Phone cases (180 units) | Screen protectors (95 units) | Ring lights (82 units) | Phone cases (48 units) | — |
Actionable Insight: Notice how TikTok Shop has the lowest AOV but highest return rate (12.4%). This is common for impulse-buy platforms — your sales report should flag channels where high returns eat into margins. Use an Etsy or Lazada fee calculator to model true profitability per platform.
A sales summary report provides a high-level overview, making it ideal for executive presentations or team meetings. According to the U.S. Small Business Administration, summarising financial performance regularly is one of the top habits of successful small businesses.
What to Include:
Example — Weekly Executive Summary:
| Metric | This Week | Last Week | Change |
|---|---|---|---|
| Total Revenue | $11,240 | $9,870 | +13.9% |
| Gross Margin | 42.3% | 39.8% | +2.5pp |
| Units Sold | 387 | 342 | +13.2% |
| Return Rate | 6.1% | 7.8% | −1.7pp |
| Top Win | Shopee 9.9 campaign drove +45% orders | — | — |
| Key Issue | Lazada stockout on SKU-2847 (3 days) | — | — |
Use a sales performance report to track how individual team members or departments are performing against targets.
What to Include:
Example:
| Salesperson | Target($) | Achieved($) | Conversion Rate |
|---|---|---|---|
| Alex Jones | 50,000 | 48,000 | 20% |
| Jamie Lee | 45,000 | 55,000 | 25% |
A product sales report focuses on individual product performance across all your sales channels, helping you identify your best-sellers and flag underperforming SKUs that tie up capital. This is where understanding your retail pricing becomes critical — you need to see both revenue and margin side by side.
What to Include:
Example — Cross-Platform Product Performance:
| SKU | Product | Shopee | Lazada | TikTok | Shopify | Total Units | Revenue | Margin |
|---|---|---|---|---|---|---|---|---|
| PHC-001 | Silicone Phone Case | 180 | 95 | 42 | 48 | 365 | $5,475 | 52% |
| SPR-003 | Screen Protector (3pk) | 120 | 85 | 28 | 22 | 255 | $3,825 | 61% |
| RNG-007 | LED Ring Light | 15 | 8 | 82 | 5 | 110 | $4,400 | 38% |
| CBL-012 | USB-C Cable (2m) | 95 | 60 | 55 | 30 | 240 | $2,400 | 45% |
Actionable Insight: SKU RNG-007 sells 7.5x more on TikTok Shop than any other channel. This signals a product-market fit unique to that platform’s audience. Consider creating TikTok-exclusive bundles or promoting it through live selling to amplify this advantage.
This report digs into sales data to uncover trends and opportunities.
What to Include:
Example:
Key Insights
Using visuals like graphs, charts, and tables enhances the readability of your reports. Here’s how visuals can be used:
With OneCart’s Business Analytics feature, you can get visuals of your sales report instantly based on raw data.
If you sell on more than one platform — Shopee, Lazada, Amazon, TikTok Shop, your own Shopify or WooCommerce store — traditional sales reports fall short. Each marketplace has its own seller dashboard, its own fee structure, and its own way of presenting data. The result? You end up logging into 5-7 different dashboards just to understand how your business performed last week.
Here’s what makes multichannel sales reporting so difficult:
A consolidated multichannel sales report should include:
| Section | What It Shows |
|---|---|
| Revenue by channel | Which platforms generate the most sales (and the most profit after fees) |
| Unit economics | Actual margin per product per platform, after marketplace fees |
| Inventory health | Stock levels, turnover rates, and products at risk of stockout |
| Channel comparison | Period-over-period performance for each platform side-by-side |
| Top & worst sellers | Best and worst performing SKUs across all channels |
Actionable Insight: The most valuable metric in multichannel reporting isn’t total revenue — it’s profit per channel after fees. A channel generating $10,000 in revenue with 25% fees is less valuable than one generating $7,000 with 8% fees. Use a markup calculator to verify your margins per platform.
One of the biggest traps in multichannel reporting is assuming that the same metric means the same thing across platforms. Here’s how key sales metrics differ:
| Metric | Shopee | Lazada | Amazon | TikTok Shop |
|---|---|---|---|---|
| Conversion Rate | Visitors ÷ orders (includes window shoppers) | Unique visitors ÷ orders | Unit session % (units ÷ sessions) | Video views ÷ orders (content-driven) |
| Settlement Period | Bi-weekly (SG), varies by market | Weekly payouts | 14-day rolling | Weekly after buyer confirms |
| Commission Model | Category-based (1-6%) + service fee + payment fee | Category-based (1-5%) + payment fee | Referral fee (8-15%) + FBA if applicable | Flat referral (1-8%) + affiliate if used |
| Return Window | 7-15 days (Shopee Guarantee) | 7-14 days (LazMall longer) | 30 days (A-to-Z Guarantee) | 15 days (varies by category) |
| Ad Metrics | Shopee Ads CPC, ROAS | Lazada Sponsored Solutions CPC | ACoS (ad cost of sales) | CPM for in-feed, CPC for search |
This matters because a 15% conversion rate on Shopee and a 15% unit session percentage on Amazon are measuring fundamentally different things. Your sales report needs to normalise these metrics or at minimum flag which platform’s definition is being used.
Manually compiling data from each marketplace is time-consuming and error-prone. Modern ecommerce automation tools can consolidate your sales data automatically:
OneCart connects to 13+ platforms including Shopee, Lazada, Amazon, TikTok Shop, Qoo10, and WooCommerce, providing consolidated sales reports, profit analytics, and top/worst selling SKU analysis from a single dashboard.
Writing a clear and effective sales report doesn’t have to be complicated. Follow these steps to ensure your report delivers actionable insights and aligns with your business goals.
Start by clarifying why you’re writing the report. Is it for tracking monthly sales performance, presenting to stakeholders, or evaluating team productivity? Understanding the purpose will guide what data to include and how to structure the report.
Decide on the specific metrics you want to track. Common KPIs for sales reports include:
Gather data from your CRM, sales software, or spreadsheets. If you sell on multiple platforms, you’ll need to pull data from each marketplace dashboard — or use multichannel inventory management software that consolidates everything automatically. Ensure the data is complete and up-to-date. Reliable data is critical for creating a report that stakeholders can trust.
Organize your data into sections, such as revenue, sales performance, and trends. Use tables and charts to present the information in a format that’s easy to understand. For example:
Data alone isn’t enough—your report should include insights and recommendations. Answer questions like:
Example:
“Sales in Region A dropped by 10% compared to last month. We recommend increasing marketing efforts in this area and offering targeted promotions to boost performance.”
A well-organized format makes your report more effective. Follow these formatting tips:
Before finalizing, review the report for accuracy, clarity, and relevance. Make sure all data is correct and aligns with the report’s purpose. Share the completed report with the intended audience via email, presentations, or a shared dashboard.
Even with the best tools and templates, sales reports can fall short if common mistakes creep in. Below are key mistakes businesses make when creating sales reports and actionable tips to avoid them.
The Problem:
Overloading your sales report with excessive data can overwhelm the reader and obscure critical insights.
How to Avoid:
The Problem:
Reports that simply list metrics without analysis fail to provide actionable value.
How to Avoid:
The Problem:
Disorganized or inconsistent formatting makes reports harder to read and compare.
How to Avoid:
The Problem:
Reports based on old or incorrect data lead to poor decision-making and a loss of credibility.
How to Avoid:
The Problem:
Relying solely on text and numbers makes reports less engaging and harder to understand.
How to Avoid:
The Problem: Revenue is important, but overlooking other metrics like conversion rates, customer retention, or product performance gives an incomplete picture. As Harvard Business Review notes, understanding the full economics of your business requires looking beyond top-line numbers.
How to Avoid:
The Problem:
Reporting raw numbers without context, such as comparisons to previous periods or industry benchmarks, limits the value of insights.
How to Avoid:
Creating a clear and actionable sales report requires avoiding these common pitfalls. By focusing on relevant data, providing context, and ensuring accuracy, your reports can drive smarter decisions and better sales strategies.
Sales reporting for ecommerce is evolving rapidly. Here are the key trends shaping how sellers track and analyse their performance in 2026:
Real-time dashboards are replacing static reports. Instead of waiting for end-of-week or end-of-month reports, sellers now expect live data that updates as orders come in. This is especially important during flash sales and campaign events where seasonal inventory management decisions need to happen in minutes, not days.
AI-powered anomaly detection is becoming standard. Rather than manually scanning tables for dips, modern reporting tools flag unusual patterns automatically — a sudden drop in conversion rate, an unexpected spike in returns, or a pricing error that’s costing margin. According to Statista’s ecommerce analytics report, over 60% of mid-market ecommerce businesses now use some form of automated reporting.
Profitability-first reporting has replaced revenue-first thinking. The shift from “how much did we sell?” to “how much did we actually keep?” is now mainstream. With marketplace fees, shipping costs, returns, and ad spend all eating into margins, sellers need reports that show profit after all deductions — not just top-line revenue. This is particularly critical for sellers on multiple platforms where fee structures vary significantly.
Cross-border reporting adds complexity. As more Southeast Asian sellers expand to markets like Australia, Japan, and the US, sales reports must handle multiple currencies, tax regimes, and landed cost calculations. A sale in USD that settles in SGD after forex conversion has a different actual value than what the marketplace dashboard shows.
A sales report is a document that summarises your business’s sales activities, performance, and trends over a specific period. It includes key metrics like revenue, units sold, conversion rates, and channel performance to help businesses make data-driven decisions.
The most common types include daily sales reports, weekly sales reports, monthly sales reports, sales summary reports, sales performance reports, product sales reports, and sales analysis reports. For ecommerce sellers on multiple platforms, a consolidated multichannel report is also essential.
Start by defining the report’s purpose, then choose relevant metrics like revenue by channel, conversion rates, and inventory performance. Gather data from each marketplace (Shopee, Lazada, Amazon, etc.) or use a multichannel tool like OneCart to consolidate data automatically. Organise the data with charts and tables, then add actionable insights.
Yes. Tools like OneCart consolidate sales data from Shopee, Lazada, Amazon, TikTok Shop, and other platforms into a single dashboard with automated reports, P&L analytics, and top-selling SKU analysis — eliminating the need to log into each marketplace separately.
Daily reports help catch issues early (stockouts, pricing errors), weekly reports reveal short-term trends, and monthly reports are best for strategic planning. Most successful ecommerce sellers review daily summaries and deep-dive weekly.
For basic reporting, Google Sheets or Excel with marketplace data exports work well. Most platforms (Shopee Seller Centre, Lazada Seller Center, Amazon Seller Central) offer built-in sales dashboards you can export as CSV files. For multichannel sellers who need consolidated reporting across platforms, OneCart provides automated P&L reports, channel comparisons, and inventory analytics from a single dashboard. Our profit margin calculator and break-even calculator are also free tools that complement your reporting workflow.
A sales report focuses on sales activity — revenue, units sold, conversion rates, and channel performance. A P&L (profit and loss) statement is broader, covering all income sources minus all expenses (including overhead, salaries, rent, and platform fees) to show net profit. For ecommerce sellers, the most useful document combines both: a channel-level P&L that breaks down revenue and all associated costs per marketplace, revealing your true margin after fees.
Sales reports are a cornerstone of effective sales management — and in 2026, they’re more important than ever for ecommerce sellers juggling multiple platforms. Whether you’re tracking monthly progress across Shopee and Lazada, analysing which channel delivers the best margins, or evaluating product performance across your entire catalogue, a well-crafted report ensures you can make decisions based on data, not guesswork.
The key takeaways:
Ready to consolidate your multichannel sales data into one clear report? OneCart connects to 13+ platforms — Shopee, Lazada, Amazon, TikTok Shop, WooCommerce, and more — giving you consolidated sales reports, profit analytics, and inventory insights from a single dashboard. Start your free trial.
Automate & Scale Your Online Business with OneCart
Start a Free TrialUsed by hundreds of merchants in Singapore & Southeast Asia