Your Guide to Safety Stock Computation for Ecommerce Growth [2026]
Master safety stock computation to prevent stockouts and protect profits. Learn simple and advanced formulas with real-world examples for your online store.
Master safety stock computation to prevent stockouts and protect profits. Learn simple and advanced formulas with real-world examples for your online store.
Running out of stock is a direct blow to your sales and your ranking on competitive marketplaces. A proper safety stock computation is your strategic buffer, the cushion that protects you from a sudden spike in demand or an unexpected delay from your supplier. Think of it as an insurance policy for your revenue stream.

Safety stock is the extra inventory you hold to prevent stockouts. It’s the difference between telling a customer “sorry, it’s on backorder” and closing a sale while your competitor is scrambling to restock. For anyone selling on fast-moving platforms like Shopee, Lazada, and TikTok Shop, this buffer is essential for consistent growth.
Without a calculated safety stock, you’re just guessing. That guesswork almost always leads to one of two expensive problems that can quietly sink an otherwise healthy ecommerce business.
Holding too much inventory is a silent profit killer. Every unit sitting on a warehouse shelf represents cash that could be fueling your marketing, developing new products, or improving your cash flow. This excess stock ties up capital and racks up carrying costs—think warehouse fees, insurance, and the risk of products getting damaged or becoming obsolete.
Practical Example: Imagine you sell phone cases and decide to keep an extra 500 units of every color, just to be safe. For your best-selling black case, that might make sense. But for that slow-moving lime green case, those 500 units could sit there for months. If each case costs you $5, you have $2,500 in cash tied up in a product that isn’t selling, while also paying for the space it occupies.
Running out of stock feels even worse, and the damage is far more immediate and widespread. The most obvious cost is the lost sale, but the ripple effects are what really hurt, especially in a competitive marketplace environment.
A stockout can trigger a cascade of negative consequences:
Actionable Insight: The goal of safety stock computation is to find the sweet spot. You need just enough inventory to protect your sales and service levels without tying up unnecessary cash in products that aren’t moving.
This guide is about ditching the guesswork. Whether you start with a simple method or jump to a more advanced statistical formula, the goal is the same: to make a data-informed decision. Systems like OneCart use these inputs to help you manage inventory across all your channels, ensuring your safety buffer works for your entire business.
You don’t need a degree in statistics to get started with safety stock. Some of the most practical methods are simple rules that give you a solid baseline. These approaches are perfect for getting a handle on your inventory buffer without getting bogged down in complex formulas.
Let’s start with the most basic one: the Fixed Days of Supply method. You simply decide to keep a set number of days’ worth of inventory on hand as your buffer. It’s an easy-to-understand starting point, especially if your products have stable and predictable demand.
To use this method, you only need your average daily sales. Say you sell 20 units of a product per day on average, and you decide you want 14 days of safety stock as a cushion.
The calculation is 20 units/day × 14 days = 280 units. This means you’ll hold an extra 280 units in your warehouse to guard against minor hiccups.
While simple, the big drawback here is rigidity. This method doesn’t react to sudden spikes in your sales or unexpected delays from your supplier. If a product suddenly goes viral on TikTok or a container gets stuck in customs, this fixed buffer might not be enough. It’s a great first step, but you’ll likely outgrow it.
Actionable Insight: Use the Fixed Days method for your ‘C’ items—the slow-but-steady sellers that don’t justify a deep analytical dive. For your bestsellers, you’ll want a formula that better reflects real-world volatility.
For a much more robust approach, the Average-Max method is highly practical because it forces you to look at the worst-case scenarios from your own sales and supply chain history. It considers both your peak sales periods and your longest supplier lead times to build a buffer based on actual volatility.
The formula is: Safety Stock = (Maximum Lead Time × Maximum Sales) – (Average Lead Time × Average Sales).
This calculation finds your inventory needs for a worst-case scenario and then subtracts your needs for a typical scenario. The difference is your safety stock buffer.
Practical Example: A merchant on Shopee might see peak daily sales of 500 units during a big sale, with a maximum supplier lead time of 14 days. On a normal day, their average sales are 300 units with a 10-day lead time.
The calculation would be: (14 days × 500 units) – (10 days × 300 units) = 4,000 units. This method is especially valuable for sellers using a system like OneCart to manage high order volumes during major events like 11.11, as it builds in protection right when you need it most. You can learn more about different approaches to safety stock calculation to see how this fits into a broader strategy.
Let’s walk through another real-world example for a multi-channel seller.
Scenario: A Multi-Channel Seller’s Bestselling Product
Imagine you sell a popular skincare product on both your Shopify store and your Lazada marketplace shop. You need to figure out the right safety stock to keep things running smoothly across both channels.
Here’s your data from the last three months:
Now, let’s plug these numbers into the Average-Max formula.
Calculate the ‘Worst-Case’ Scenario:
Calculate the ‘Average’ Scenario:
Find the Difference for Your Safety Stock:
Based on this, you should hold 2,250 units as your safety stock. This buffer is designed to cover you if your supplier is at their slowest and your sales are at their highest at the same time, ensuring you can keep fulfilling orders across both Shopify and Lazada without a single stockout.
Before moving on to more advanced statistical models, it helps to see these two basic methods side-by-side. Each has its place, and choosing the right one depends on your product’s sales patterns and your operational complexity.
| Method | Formula / Concept | Best For | Pros | Cons |
|---|---|---|---|---|
| Fixed Days of Supply | Average Daily Sales × Number of Safety Days | Products with stable, predictable demand (‘C’ items). New businesses with limited historical data. | Very easy to calculate and understand. Provides a simple, consistent buffer. | Doesn’t account for demand or lead time variability. Can lead to stockouts during spikes or overstocking during lulls. |
| Average-Max | (Max Sales × Max Lead Time) – (Avg Sales × Avg Lead Time) | Best-selling products (‘A’ items) with fluctuating demand and variable lead times. | Based on actual historical volatility. Provides a much more realistic and robust safety buffer. | Requires more historical data (maximums and averages). Can result in higher inventory holding costs. |
Ultimately, both are fantastic starting points. The Fixed Days method gets you in the game, while the Average-Max method gives you a much more reliable cushion for the products that truly drive your business.
Once you’re ready to graduate from simple rule-of-thumb calculations, statistical models are the next logical step. They give you a direct, data-driven way to connect your safety stock levels to your desired customer service level. This is the approach you want for fine-tuning inventory with real precision, especially for your A-list products.
The most common way to do this is with a Z-score. The core idea is simple: it helps you quantify the risk of a stockout and build a buffer that aligns with your business goals.
The formula at the heart of this method is: Safety Stock = Z-score × Standard Deviation of Demand × √Lead Time. Let’s pull that apart so it’s easy to see how each piece works.
Using the Z-score method is a major upgrade because it leverages your own historical sales volatility to build a much smarter, more responsive buffer.
Your service level is a business decision. Are you okay fulfilling orders correctly 90% of the time, or is 98% your non-negotiable standard? Your answer determines the Z-score you’ll use. Higher service levels keep customers happy but also mean tying up more cash in inventory.
Here’s a quick reference table for the most common service levels and their Z-scores.
| Desired Service Level | Z-score |
|---|---|
| 90% | 1.28 |
| 95% | 1.65 |
| 97.5% | 1.96 |
| 99% | 2.33 |
Practical Example: Picture a DTC brand on Shopify that’s just expanded its best-selling cosmetic product to TikTok Shop.
Plugging those numbers into the formula, we get: 1.28 × 15 × √10 ≈ 61 units. This means the brand should aim to hold 61 units as safety stock to maintain its 90% service level, giving it a solid cushion against unexpected demand spikes across both channels.
Many businesses don’t just order based on past sales; they use a forecast to determine their regular stock. If that’s you, you should replace the “standard deviation of demand” with the “standard deviation of forecast error.”
Actionable Insight: This simple change forces your safety stock to protect you from your forecast’s inaccuracies—which is precisely what a buffer is for. This refinement is critical for planning around seasonal peaks or promotions where simple historical demand is not a reliable guide.
This adapted approach is a lifesaver for marketplace sellers juggling inventory across platforms like Shopee, Lazada, and TikTok Shop, where forecast accuracy can swing wildly. For an operation using a platform like OneCart to sync inventory while pushing out hundreds of orders a day, this kind of statistical precision is invaluable. Maintaining a 95% service level often requires about 29% more safety stock than a 90% level—a trade-off that data-driven merchants can now calculate and optimize.
When building any statistical model for inventory, your starting point has to be solid. A reliable mean calculator is essential for accurately figuring out your average demand or lead time, ensuring your inputs are correct from the very beginning.
Ultimately, using statistical models allows you to explicitly define the relationship between your inventory investment and your service level targets. It turns inventory management from a guessing game into a strategic business decision. As you get the hang of this, you might also find our guide on demand planning and forecasting to master your supply chain helpful.
A perfectly calculated safety stock number on a spreadsheet is just a number. The real value comes when you integrate it into your daily operations, turning a theoretical figure into an automated trigger that protects your business from stockouts. This is where your inventory management system becomes your most valuable player.
Once you’ve determined your safety stock value for a specific SKU, it becomes a core part of your reorder point (ROP), which is the inventory level that tells you it’s time to order more. While reorder point tells you when to order, you’ll also want to know how much to order — that’s where the EOQ calculator comes in, helping you find the optimal order quantity to minimise total costs.
The formula is simple but incredibly powerful:
Reorder Point = (Average Daily Sales × Average Lead Time) + Safety Stock
This means your system triggers a new purchase order while you still have enough stock to cover sales during the replenishment lead time, plus your safety buffer.
In a modern system like OneCart, this isn’t a manual task. You input your safety stock level and reorder point directly into the SKU’s settings. Once set, the platform does the heavy lifting, monitoring your inventory levels in real-time across all your channels—Shopee, Lazada, TikTok Shop, and your own website.
When the available stock for a product dips to its reorder point, the system can automatically:
This is how your safety stock moves from being a passive idea to an active operational guardrail. It ensures that the results of your careful safety stock computation are put to work to prevent stockouts before they happen.
The process flow below shows how the key variables from statistical methods—your Z-score, demand standard deviation, and lead time—all come together to build that precise safety stock number.
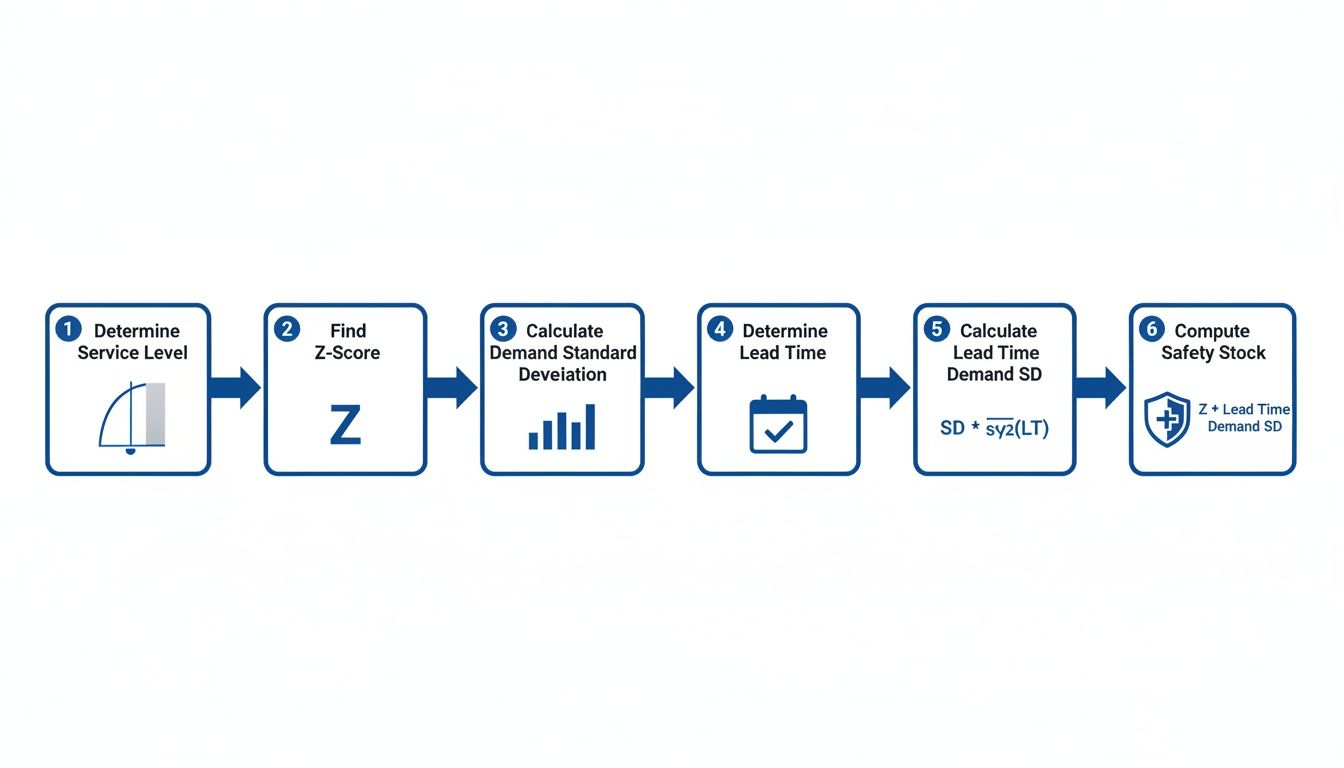
As you can see, a reliable safety stock figure is built by combining a business decision (your desired service level) with hard data (demand and lead time variability). That final number is then ready to be plugged right into your inventory system.
One of the biggest mistakes sellers make is applying a blanket rule, like a generic “14 days of stock” for every product. This is a surefire way to tie up cash and hurt your business. Your fast-moving, high-margin products deserve a much stronger safety net than your slow-moving items.
Actionable Insight: A core principle of smart inventory management is differentiation. Calculate safety stock for a bestselling skincare serum with a high service level (e.g., 98%), while a less popular accessory might only warrant an 85% service level to avoid tying up capital in slow-moving goods.
To apply this effectively, you need to prioritize. A great way to do this is by mastering ABC Analysis Inventory. This method helps you classify products based on their value to your business, so you can apply more rigorous safety stock calculations where they’ll have the biggest financial impact. You can also play around with different scenarios for your top products with a handy safety stock calculator.
For anyone selling across multiple channels, a centralized inventory system is a complete game-changer for safety stock. When your Shopify, Lazada, and TikTok Shop inventory pools are all managed from one place like OneCart, your safety stock truly protects your entire business.
Practical Example: Say you hold 100 units of safety stock for a top-selling product. Without a unified system, you might be forced to split it—maybe 50 units for your Shopify warehouse and 50 for your marketplaces. If you get a huge sales surge on Lazada, you can stock out there while inventory sits uselessly in your Shopify location.
With a centralized view, that 100-unit buffer serves all channels from a single, unified pool of stock. A sudden sales spike on any platform can be fulfilled from that same inventory, making your safety buffer far more efficient. It’s the key to preventing overselling and ensuring your carefully calculated protection level works for you, no matter where the customer decides to buy.
Your safety stock number isn’t a one-and-done calculation. One of the costliest mistakes in inventory management is treating it as a “set it and forget it” figure. The market, your suppliers, and your customers are always changing, which means your safety stock levels have to be dynamic enough to keep up.
Think of it this way: locking in a safety stock number and never touching it again is like setting a course on a map and refusing to adjust for traffic or roadblocks. You’ll eventually run into trouble.
Establishing a regular review cadence is the first step toward building a responsive inventory strategy. It stops your safety stock from becoming stale and ensures your cash is always working as hard as it can for you.
A rigid, one-size-fits-all review schedule is almost as bad as not having one. The right frequency comes down to a product’s sales velocity and volatility. A much better approach is to segment your products and assign review cycles based on how they behave in the market.
A good starting point looks something like this:
Actionable Insight: This schedule is a baseline. Certain events should always trigger an immediate recalculation, no matter when the next review is planned. Waiting it out means you’re operating with outdated data.
Some business changes can make your current safety stock numbers obsolete overnight. If you wait for your next scheduled review in these cases, you’re exposing your business to stockouts or overstocking.
Be ready to rerun your calculations immediately if you encounter any of these scenarios:
How do you know if your safety stock strategy is working? You have to track the right Key Performance Indicators (KPIs). These metrics give you the hard data you need to see what’s working and where to make intelligent adjustments.
Focus on a handful of high-impact KPIs:
By regularly monitoring these KPIs, you can move from just calculating safety stock to actively managing it. To go deeper on the metrics that matter, mastering inventory analytics can provide key insights.
This continuous loop—calculate, implement, monitor, and refine—is what separates thriving ecommerce businesses from those constantly fighting fires. It turns your safety stock from a static number into a living part of your growth strategy.
Once you get past the theory and start using safety stock calculations in your day-to-day operations, the practical questions pop up. Getting clear answers to these common hurdles is key to making your inventory strategy work.
For most products, a quarterly review is a solid baseline. This rhythm is frequent enough to catch meaningful trends in your sales data without creating excessive administrative work.
For your bestsellers (‘A’ items), seasonal products, or anything with volatile demand, a monthly check-in is a much smarter move. This ensures your buffer for these critical SKUs is always aligned with current market conditions.
Beyond a set schedule, a few events should trigger an immediate recalculation:
No. Applying a one-size-fits-all safety stock rule is a fast way to overstock on slow-movers while selling out of your best products.
Instead, segment your inventory using an ABC analysis.
These two concepts work together.
The reorder point formula shows how they’re connected: (Average Daily Sales × Average Lead Time) + Safety Stock. Your safety stock is a critical component that ensures your reorder point is set correctly, prompting you to replenish inventory well before you risk a stockout.
Calculating a buffer for a new product with no sales history requires using proxy data.
Start by looking at the sales data of the most similar products in your catalog. How did they perform in their first few months? You can also research comparable products to get a general feel for demand.
For your first couple of purchase orders, it’s wise to be conservative and hold a slightly higher safety stock than you think you’ll need. The most important thing is to monitor sales velocity closely for the first few weeks. As soon as you have a month of real data, you can plug it into a proper safety stock formula and fine-tune your levels.
Ready to stop guessing and start making data-driven inventory decisions? OneCart centralizes your inventory across all channels like Shopee, Lazada, and Shopify, giving you the real-time data and control you need to implement a smart safety stock strategy. Learn how OneCart can help you prevent stockouts and scale your business.
Automate & Scale Your Online Business with OneCart
Start a Free TrialUsed by hundreds of merchants in Singapore & Southeast Asia