Safety Stock Calculator: A Guide to Smarter Inventory Management [2025]
Use our safety stock calculator guide to prevent stockouts and optimize inventory. Learn the right formulas with actionable examples to cut costs.
Use our safety stock calculator guide to prevent stockouts and optimize inventory. Learn the right formulas with actionable examples to cut costs.
A safety stock calculator is a simple tool that does something incredibly important: it tells you how much extra inventory you need to keep on hand to avoid running out of stock. It’s the difference between guessing and knowing, moving your business from risky gut feelings to a smart, data-driven strategy. Want to skip the formulas and get your number right now? Try our free safety stock calculator tool — just enter your data and get instant results.
This means you’ll have enough buffer stock to handle unexpected demand or supplier delays, but without tying up a ton of cash in your warehouse. Once you know your safety stock level, use the reorder point calculator to determine exactly when to place your next order.
Think back to the last time a popular product sold out when you weren’t expecting it. The consequences hit hard, didn’t they? Lost sales, annoyed customers, and a knock to your brand’s reputation. This is exactly where a safety stock calculator becomes one of the most vital tools in your inventory management kit. It’s not just about having extra items; it’s about holding the right amount of extra items.
This guide tackles the two biggest headaches for any inventory manager: the high carrying costs from overstocking and the customer churn from understocking. We’ll get straight to the point with clear formulas and practical scenarios to help you find that perfect inventory balance.
Relying on intuition to set your inventory buffer is a dangerous game. You either end up with capital locked up in products gathering dust or face the fallout from an empty shelf. Either way, a miscalculation hits your bottom line directly.
Holding too much inventory can inflate your carrying costs by 20-30% of your stock’s value every single year. On the flip side, not having enough leads to stockouts, which means an immediate loss of sales and can send your long-term customers straight to your competitors.
A systematic approach using a safety stock calculator helps you sidestep these problems entirely. It makes you look at the hard data—historical sales, supplier performance, and demand swings—turning inventory management into a calculated science rather than a shot in the dark. For a deeper dive, learn more about what a stockout is and how you can avoid it.
This data-driven approach isn’t just theory; it’s delivering real results for businesses here in Singapore. The adoption of safety stock calculators among small and medium enterprises (SMEs) has shot up recently. In fact, a 2022 survey found that local businesses using these tools saw a 23% reduction in stockouts and cut their excess inventory costs by 17% compared to those still relying on manual methods.
Here’s a quick look at some common inventory pain points and how safety stock offers a direct fix.
A quick look at common inventory issues and how a solid safety stock strategy provides a direct solution, helping you see the immediate value.
| Common Inventory Problem | The Safety Stock Solution | Real-World Business Impact |
|---|---|---|
| Sudden sales spikes during holidays or promotions leave shelves empty. | Calculates a buffer based on historical demand volatility, ensuring you have extra units ready. | You capture every sale during peak periods instead of sending customers away disappointed. |
| Unexpected supplier delays (e.g., shipping hold-ups, production issues). | Factors in lead time variability, giving you enough stock to cover the longest possible wait. | Your operations continue smoothly, and you can still fulfil orders even when a shipment is late. |
| Tying up too much cash in slow-moving inventory. | Provides a data-based calculation to prevent over-ordering “just in case.” | Frees up your cash flow for marketing, new product development, or other growth areas. |
| Losing repeat customers because an item is frequently out of stock. | Ensures consistent product availability, which builds trust and reliability. | Customer loyalty improves, leading to more repeat purchases and a stronger brand reputation. |
As you can see, the benefits are tangible and immediate.
By using a safety stock calculator, you can:
This guide offers a practical, step-by-step approach to protecting your business, and we’ve even included a free downloadable tool to help you get started right away.
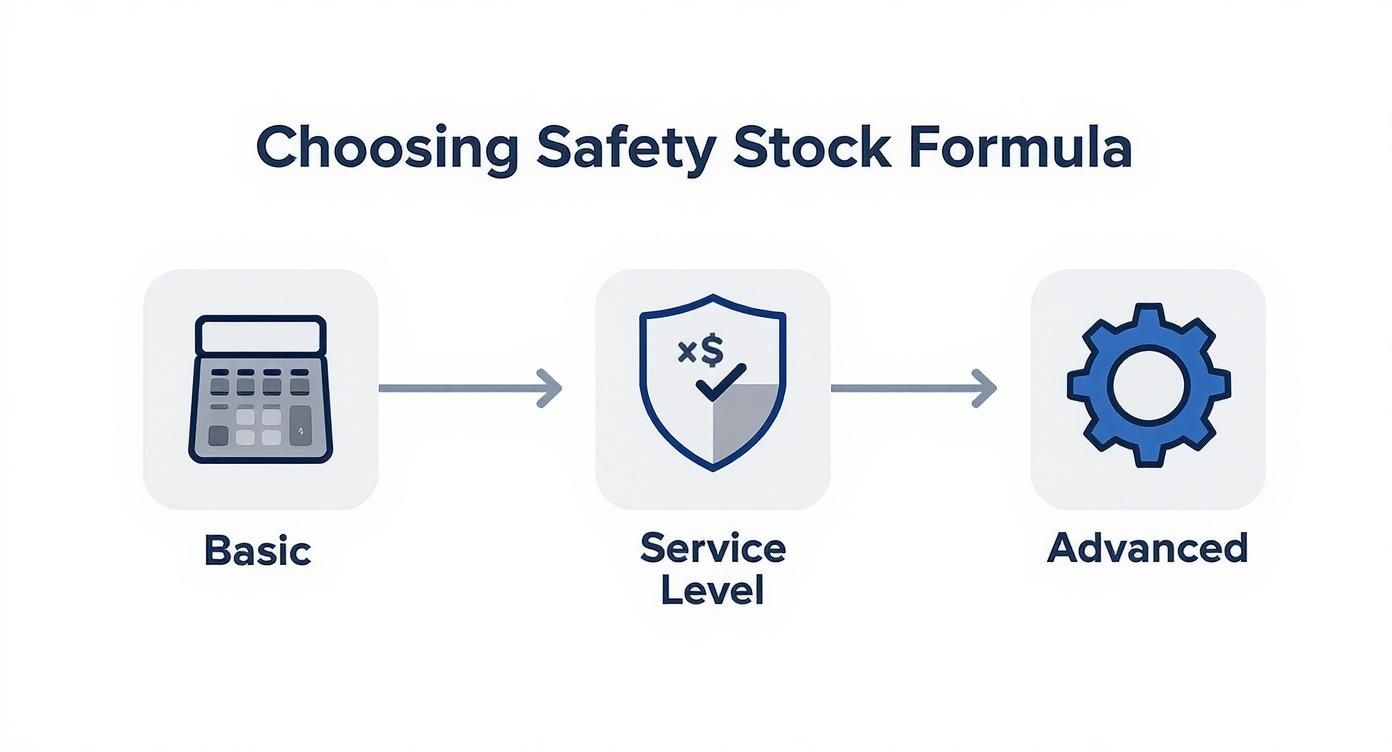
Picking a safety stock formula isn’t just a technical exercise; it’s a strategic decision that hits your cash flow and customer happiness directly. The best approach for you hinges on the data you have, how stable your sales are, and frankly, how much risk you’re willing to stomach.
Not all methods are created equal, so let’s walk through the three most practical options for e-commerce sellers. We’ll start with a dead-simple formula that’s perfect for a quick baseline. Then, we’ll dive into a more refined method that links your inventory directly to your customer service goals. Finally, we’ll cover an advanced approach for when both your sales and supplier deliveries feel like a total guessing game.
When you’re starting out, or for those reliable products with consistent sales and solid suppliers, the basic safety stock formula is your best friend. It’s quick, easy, and gives you a solid foundation without needing to dust off your old statistics textbook.
Here’s the formula: (Maximum Daily Sales x Maximum Lead Time) – (Average Daily Sales x Average Lead Time)
What this does is create a buffer based on the worst-case scenario you’ve actually seen. It calculates the gap between a “perfect” replenishment cycle and the longest, busiest one you’ve ever had.
Practical Example: The “Classic White Tee”
Let’s say you sell a popular “Classic White Tee.” A quick look at your sales data shows:
Plugging these numbers into a safety stock calculator (or a simple spreadsheet) looks like this:
Actionable Insight: This tells you to keep an extra 116 shirts in stock, just in case. This buffer will cover you against those unexpected sales spikes or supplier delays. It’s a beautifully simple and effective method for your most predictable SKUs.
But what if you want to be more intentional about preventing stockouts? Instead of just planning for the worst day on record, the Service Level method lets you decide precisely how often you’re willing to risk an empty shelf. It uses a statistical value called a Z-score to match your inventory levels to a specific customer service promise.
A 95% service level, for example, means you’re aiming to have an item in stock and ready to ship for 95 out of every 100 orders that come in. This is a powerful way to protect the availability of your best-sellers.
The formula looks a bit more intimidating, but the idea is simple: Z-score x Standard Deviation of Lead Time Demand
To get the Standard Deviation of Lead Time Demand, you need this calculation: √((Average Lead Time x Standard Deviation of Sales²) + (Average Sales² x Standard Deviation of Lead Time²))
Don’t sweat the maths. A spreadsheet or a good inventory tool handles the heavy lifting. The key is understanding what it’s telling you: exactly how much buffer you need to confidently hit your service level target.
Practical Example: The “Limited Edition Sneakers”
Imagine you sell high-demand sneakers and want to make sure they’re almost always available. You’re aiming for a 95% service level, which translates to a Z-score of 1.65.
Here’s your data:
First, we calculate the standard deviation of lead time demand:
Now, we can figure out the safety stock:
Actionable Insight: You’d round that up to 111 pairs. By holding this much extra stock, you can be 95% certain you won’t disappoint customers looking for these crucial sneakers, even when sales are a bit choppy and your supplier has a minor hiccup.
Let’s be honest, some products are just unpredictable. Maybe it’s a seasonal item with crazy demand swings, or you’re dealing with a new supplier whose delivery times are all over the map. For these situations, you need a formula that tackles both demand and lead time variability head-on.
This method separates the buffer you need for sales uncertainty from the buffer you need for supplier uncertainty, then combines them for a more complete picture.
Here’s a common version of the formula that works especially well when your lead time is fairly stable but your demand is not: (Z-score x Standard Deviation of Sales x √Average Lead Time)
This approach focuses your buffer on guarding against sales volatility over the entire replenishment period.
Practical Example: The “New Viral Gadget”
You’ve just launched a new tech gadget that’s blowing up on TikTok. Sales are amazing, but completely erratic.
Your early data looks something like this:
Let’s run the numbers:
Actionable Insight: Holding 143 units in reserve gives you a 90% chance of weathering the unpredictable sales surges for this hot item. This is crucial—it stops you from stocking out right when the product is gaining momentum, which is the worst possible time for a new launch to go dark. Each formula serves a different purpose, and picking the right one is the first real step toward smarter inventory control.
Theory is one thing, but actually crunching the numbers is where the real learning happens. Let’s get our hands dirty and walk through a proper safety stock calculation for a single product, from finding the data to getting a final number you can actually use.
We’ll be using the Service Level / Z-score method. It’s the sweet spot for most marketplace sellers – a huge leap in accuracy from the basic formula without getting overly complicated. Think of this as a mini-workshop. Grab a spreadsheet and follow along with your own product data.
Before you can calculate anything, you need the right ingredients. The most common roadblock isn’t the maths; it’s knowing which numbers to pull and where to find them. You’ll need four key pieces of information.
That term “standard deviation” can sound intimidating, but spreadsheets like Google Sheets or Excel make it dead simple. It’s a non-negotiable input for any reliable safety stock calculation because it’s how you quantify your sales risk.
Let’s imagine you’re looking at sales for your best-selling “Product X.” You’ve pulled the daily sales data for the last 30 days and dropped it into a single column in your spreadsheet (say, cells A1 through A30).
Finding the standard deviation is as easy as using one simple function: STDEV.P.
Just click on any empty cell and type: =STDEV.P(A1:A30)
That’s it. The function looks at all the daily sales figures in that range and spits out a single number representing the sales volatility for that period.
This gives you a concrete value for your demand uncertainty, which is exactly what we need for an accurate calculation.
Okay, let’s plug our numbers for “Product X” into the Z-score formula. This is where your data starts telling a story.
The formula we’re using is:
Safety Stock = Z-score x Standard Deviation of Sales x √Average Lead Time
Here are the inputs we’ve gathered for our example product:
=STDEV.P)Now, we just plug these values into the formula, breaking it down into small steps:
The result tells us we should hold approximately 31 units of “Product X” as our safety stock. This isn’t just a guess; it’s a calculated buffer designed to protect you against typical sales spikes and supplier delays, ensuring you hit that 95% service level target. It’s a world away from the old “let’s just keep two weeks of extra stock” approach.
For clarity, here’s a quick summary of our worked example in a table.
| Data Point | Value or Formula Used | Quick Note |
|---|---|---|
| Desired Service Level | 95% | A common target for important products. |
| Z-score | 1.65 | The statistical value for a 95% service level. |
| Average Lead Time (LT) | 10 days | The typical time it takes for stock to arrive. |
| Standard Deviation of Sales | 6 units | Calculated in our spreadsheet with =STDEV.P. |
| Formula Step 1 | √LT = √10 ≈ 3.16 | Square root of the lead time. |
| Formula Step 2 | Z-score x Std Dev = 1.65 x 6 = 9.9 | Calculates the demand variability buffer. |
| Final Calculation | Step 1 x Step 2 = 3.16 x 9.9 | Combines time and demand variability. |
| Final Safety Stock | 31.28 (round to 31 units) | The amount of buffer stock to hold. |
This table neatly lays out how each piece of data feeds into the final, actionable number for your inventory planning.
Actionable Tip: Don’t try to do this for every single product at once. Start with your top 10-20% of SKUs—your ‘A’ items. These are the products that cause the most pain (and lost revenue) when they stock out, so they deserve this level of attention first.
By moving beyond simple formulas, you improve both your financial health and your customers’ happiness. The skills you build here are also the foundation for more advanced demand planning and forecasting across your entire supply chain. This first calculation is your stepping stone to gaining real, data-driven control over your inventory.
Knowing which safety stock formula to use is a huge step forward. But even the best formula in the world won’t save you from a few common, costly mistakes.
Getting the most out of a safety stock calculator is as much about avoiding pitfalls as it is about crunching the numbers correctly. These errors can quietly sabotage your efforts, leading to the exact problems you’re trying to prevent in the first place: stockouts and overstocking.
The most critical mistake is something data scientists call ‘garbage in, garbage out’. If you feed your safety stock calculator outdated or inaccurate data, you’re guaranteed to get a useless result. Using sales figures from two years ago or just guessing your supplier’s lead time completely undermines the process, giving you a false sense of security.
Aiming for a 100% service level might sound great in theory, but in practice, it’s often a trap. It’s an expensive pursuit that leads to massively bloated inventory costs and diminishing returns.
Think about it: the amount of extra stock needed to get from a 95% to a 99% service level is significantly more than what it took to get from 90% to 95%.
The last few percentage points of service level are the most expensive. Pushing for 99.9% can mean doubling your safety stock for only a tiny, often unnoticeable, improvement in availability. You end up tying up huge amounts of cash in slow-moving buffer stock.
Actionable Insight: For most businesses, a 90-95% service level for key products is the sweet spot. This offers excellent protection against stockouts without crippling your cash flow. Reserve those higher service levels for only your absolute most critical, high-margin items—the ones where a stockout would be a catastrophe.
Another classic error is applying a single, blanket safety stock policy across your entire catalogue. Your fastest-selling handbag simply doesn’t have the same demand pattern or supply risk as a slow-moving seasonal accessory.
Treating them the same means you will almost certainly overstock one and understock the other. This is where inventory segmentation, often called ABC analysis, becomes so important. You need to categorise your products based on their value and how quickly they sell.
Actionable Insight: Perform an ABC analysis today. Sort your products by sales revenue over the last six months. The top 20% are your A-Items. Calculate their safety stock first and set a higher service level (e.g., 95%). For C-Items, you might even decide to hold no safety stock at all.
Perhaps the biggest ongoing mistake is treating safety stock as a one-time calculation. Your market is not static. Customer demand shifts, new competitors emerge, and supplier performance changes over time.
Your safety stock levels have to be dynamic to reflect this reality.
Failing to review and adjust your calculations is a surefire way to end up with inventory levels that are completely misaligned with your current business needs. A 2023 report highlighted the real cost of such errors, finding that Singaporean online retailers saw a 30% reduction in stockouts and a 20% boost in customer satisfaction after fixing their calculations. These figures show just how much is at stake. You can explore the full findings about key inventory performance indicators on Shipbob.com.
Actionable Insight: Schedule a review of your safety stock levels in your calendar right now. Set a recurring appointment for the first Monday of every quarter to review B and C-items, and a monthly appointment to review your A-items. This discipline ensures your inventory buffer stays relevant and effective.
While spreadsheets are a fantastic way to get your head around the basic formulas, they have a ceiling. As your business scales, manually punching in data for hundreds—or even thousands—of SKUs isn’t just a massive time sink; it’s a recipe for costly mistakes.
This is where you hit a fork in the road. You can either hire more people to manage spreadsheets or you can make the smart move and put your safety stock calculations on autopilot.
Modern inventory management platforms are built for this exact challenge. Forget spending hours exporting sales reports and chasing supplier delivery times. These systems plug directly into your data sources, syncing with sales channels like Shopee, Lazada, and Shopify, while also integrating with your purchase orders to paint a live, accurate picture of your operations.
The real magic of automation is how it transforms your safety stock from a static number into a dynamic, living buffer. An automated system doesn’t just run the numbers once a quarter. It’s constantly monitoring your sales velocity, supplier lead times, and demand swings in near real-time.
Picture this: one of your products suddenly goes viral on TikTok. An automated system will flag that sales spike instantly. It can then automatically adjust the safety stock recommendation upwards, protecting you from an impending stockout before you even realise what’s happening. This is the difference between being reactive and becoming predictive.
An inventory management platform can slash the time spent on manual calculations by over 90%. At the same time, it dramatically improves the accuracy of your buffer stock. This frees up your team to focus on high-value tasks like negotiating with suppliers or sourcing new products, instead of getting buried in spreadsheets.
Beyond simple automation, the sharpest systems now bring artificial intelligence (AI) into the mix to make forecasting even more precise. AI algorithms can dig through mountains of historical data to spot subtle trends, seasonal patterns, and demand signals that are almost impossible for a human to catch.
For example, an AI-powered tool might predict a surge in demand for a specific SKU by connecting your sales data with external factors, like an upcoming public holiday or even chatter on social media. This gives you a much more nuanced and accurate safety stock calculation than any formula alone.
This level of insight is a key piece of a bigger growth strategy. You can learn more about the tools that fuel this kind of growth in our guide to ecommerce automation for your online business.
Ready to graduate from that safety stock calculator spreadsheet? Here’s a simple roadmap to get you moving:
Making the leap from manual calculations to an automated strategy is how you build a resilient, hands-off inventory system that actually supports your growth instead of holding it back.
Even with the best formulas, theory and practice are two different things. When it comes to putting a safety stock strategy into action, questions always pop up.
Let’s tackle some of the most common ones I hear from marketplace sellers to clear up any final doubts.
For most of your products, running the numbers quarterly is a solid starting point. This rhythm keeps your buffer stock aligned with general market trends without piling on the administrative work.
But this isn’t a “set it and forget it” rule. For your fastest-selling items or products with big seasonal swings—think holiday gift sets or summer apparel—I’d strongly recommend a monthly check-in. This frequency helps you stay ahead of sharp demand spikes and prevents those painful stockouts during your most profitable seasons.
There’s no single magic number here. It’s all about striking a strategic balance between keeping customers happy and managing your inventory costs.
For your most important products (your “A-items”), aiming for a 90-95% service level is a fantastic target. It gives you robust protection against stockouts without tying up an unreasonable amount of cash.
Trying to hit that 99% mark? Be careful. It gets expensive, fast. The amount of extra stock you need to carry to close that last little gap is often disproportionately high. Before you commit to such a high target, make absolutely sure the product’s margin or strategic importance justifies the extra cost.
Absolutely, but you’ll need a slight change in mindset. The core formulas from any safety stock calculator still apply, but the financial risk of overstocking is much higher because of spoilage.
When you’re dealing with perishables, you might decide to aim for a slightly lower service level to minimise waste. Another great strategy is to pair your safety stock calculations with just-in-time (JIT) ordering principles. This ensures fresh stock arrives more frequently, but in smaller, more manageable batches.
This is probably one of the most common frustrations I hear. When your supplier’s delivery times are all over the place, the most practical solution is to use the longest realistic lead time you’ve experienced in your calculation. Start by getting a clear picture of your total lead time using our free lead time calculator, then feed that number into your safety stock formula.
Don’t use a crazy, one-off outlier, but don’t be overly optimistic either. Find a realistic “worst-case” and work from there.
This is where more advanced formulas that focus on the standard deviation of lead time become incredibly valuable. That number directly quantifies your supplier’s unreliability. More importantly, use this data as leverage. When you can show your supplier clear figures on their delivery inconsistency, it can be the start of a very productive conversation about improving their performance.
Ready to stop guessing and start calculating? OneCart centralises your sales and inventory data from Shopee, Lazada, and Shopify, giving you the accurate numbers you need for precise safety stock management. See how you can prevent stockouts and optimise your cash flow.
Automate & Scale Your Online Business with OneCart
Start a Free TrialUsed by hundreds of merchants in Singapore & Southeast Asia