Inventory Turnover Ratio in Days: Formula & Benchmarks 2026
Calculate your inventory turnover in days with a step-by-step formula. Includes ecommerce benchmarks, worked examples, and tips to sell stock faster.
Calculate your inventory turnover in days with a step-by-step formula. Includes ecommerce benchmarks, worked examples, and tips to sell stock faster.
The inventory turnover ratio in days measures how long your stock sits before it sells. The formula is straightforward: divide 365 by your inventory turnover ratio. For ecommerce sellers on marketplaces like Shopee, Lazada, and TikTok Shop, this metric is critical — a low number means products move fast and cash flows freely, while a high number signals capital trapped in slow-moving goods.

Imagine your ecommerce store’s inventory is like fresh bread at a local bakery. The whole point is to sell every loaf while it’s still fresh. The time it takes to clear the entire batch before you need to bake a new one? That’s your turnover time. In the world of ecommerce, we measure this with the inventory turnover ratio in days.
This metric is a direct pulse check on your store’s financial health and operational efficiency. It cuts straight to the heart of a critical question: “How fast am I turning my investment in stock back into cash?”
A low number of days signals strong sales velocity and healthy cash flow. On the flip side, a high number suggests your capital is trapped on shelves, collecting dust instead of generating profit.
Keeping a close eye on your inventory turnover days helps you shift from guesswork to a data-driven strategy, making smarter, more profitable decisions across your entire operation. For anyone selling on competitive marketplaces like Shopee, Lazada, and TikTok Shop, mastering this metric is non-negotiable for survival and growth.
Here’s what tracking this metric really does for you:
By regularly calculating your inventory turnover in days, you get a powerful diagnostic tool for your business. It tells you which products are assets driving you forward and which are liabilities draining your resources.
Ultimately, this one number offers profound insights. If your turnover is 90 days, it means your inventory sits for about three months before being sold. If a competitor’s is 45 days, they’re converting their stock into cash twice as fast as you are, giving them a massive financial edge. Grasping this is the first real step toward building a more agile and profitable ecommerce business.

Figuring out your inventory turnover ratio in days might sound like a job for an accountant, but it’s actually a straightforward process that boils down to two simple steps. Once you break it down, you can easily pull the numbers from your own business records and get a crystal-clear picture of your operational speed.
The whole thing starts with a core metric: the Inventory Turnover Ratio. This tells you how many times you sell through your entire stock over a specific period, usually a year. From there, we’ll turn that number into a much more intuitive timeframe of days.
First, you need to calculate your base Inventory Turnover Ratio. This metric answers the question, “How many times did I completely sell and replace my inventory this year?” The formula is simple and only needs two key figures you can find in your financial statements.
Inventory Turnover Ratio = Cost of Goods Sold (COGS) / Average Inventory
To get this right, let’s quickly define what these terms mean in the real world:
Once you have your turnover ratio, the next step is even easier. You just divide the number of days in a year (365) by your ratio. This final number is your inventory turnover ratio in days, a metric that’s far more practical for making day-to-day decisions.
The formula looks like this:
Inventory Turnover Ratio in Days = 365 / Inventory Turnover Ratio
For instance, if your turnover ratio is 6, it means you sold through your entire stock six times last year. The calculation for days would be 365 / 6 = 60.8 days. This tells you that, on average, a product sits on your shelf for about 61 days before someone buys it. You can explore a deeper dive into the inventory turnover formula to see more variations and uses.
Let’s walk through a real-world example for a multi-channel seller named “GadgetHub,” who sells electronics on both Shopify and Lazada. We’ll use their numbers for the last fiscal year.
1. Find the Key Figures:
2. Calculate Average Inventory:
3. Calculate the Inventory Turnover Ratio:
4. Convert to Inventory Turnover in Days:
This calculation tells GadgetHub it takes them, on average, about 61 days to sell an item. That single number is incredibly powerful. Now they have a benchmark to measure against. For instance, many competitive retail ecommerce businesses often aim for a turnover of around 39 days to keep cash flowing freely. You can discover more insights about industry-specific turnover benchmarks at Extensiv.com. With this data in hand, GadgetHub can set a clear goal to reduce their turnover days and start digging into which specific products might be slowing them down.
So you’ve calculated your inventory turnover ratio in days and you’re left with a single number. This figure is more than just a piece of data; it’s a story about your business’s health, how efficiently you’re running things, and how well your products are connecting with the market. Figuring out what high and low numbers really mean is the key to turning this metric into a powerful decision-making tool.
The ideal number isn’t one-size-fits-all. A “good” turnover for a fast-fashion seller on TikTok Shop will look completely different from a merchant selling handcrafted furniture on Shopify. Your goal is to find that sweet spot that balances healthy sales against the risk of running out of stock, tailored to your specific industry and business model.
When your inventory turnover days are high, it means your products are spending way too much time sitting on your shelves. It’s a common challenge, but it often points to bigger issues in your operations or marketing that need a closer look. Think of it as a quiet alarm bell, warning you that cash is tied up in assets that aren’t making you money.
A high number can be a symptom of several problems:
Practical Example: The Lingering Seasonal Stock Imagine an online store that sells festive holiday sweaters. They optimistically stock up in October. If they calculate their inventory turnover days in February and find it’s over 120 days, that’s a clear sign of trouble. The seasonal demand has vanished, and now that capital is frozen in unsold sweaters until the next holiday season, racking up storage costs and risking becoming obsolete.
At first glance, a very low number of inventory days sounds like the dream. Products are flying off the shelves almost as soon as they land in your warehouse! While this often signals strong sales and high demand, an extremely low number can be a warning sign of a different set of problems.
An exceptionally low figure might indicate:
Finding the right balance is crucial. A low number is generally a good thing, but if it’s too low, you might be sacrificing potential revenue and customer satisfaction just for the sake of efficiency. The perfect number allows you to meet customer demand reliably without tying up too much cash in surplus stock.
To make this easier to digest, here’s a quick-reference table. Use it to diagnose what your inventory turnover days might be telling you about your business.
| Turnover in Days | What It Usually Means | Potential Risks | Action to Consider |
|---|---|---|---|
| Very High (e.g., 180+ days) | Products are stagnant. Capital is tied up in slow-moving stock. | Obsolete inventory, high storage costs, poor cash flow. | Run a clearance sale, bundle with faster-moving items, or review marketing. |
| Moderately High (e.g., 90-180 days) | Sales are slower than ideal. Potential overstocking or waning demand. | Reduced profitability, risk of stock becoming dated. | Increase marketing spend, re-evaluate pricing, or refine your sales forecast. |
| Healthy/Optimal (e.g., 30-90 days) | Good balance between stock levels and sales. Efficiently turning inventory into cash. | Slight risk of stockouts during unexpected demand spikes. | Monitor closely and maintain current reordering strategy. Optimize top-sellers. |
| Very Low (e.g., < 30 days) | High product demand and very fast sales. | Frequent stockouts, lost sales, strained supply chain, unhappy customers. | Increase reorder points, find backup suppliers, or consider ordering larger quantities. |
Remember, these ranges are just a general guide. What’s “high” or “low” will always depend on your industry—a grocer’s healthy range will be vastly different from a furniture store’s. The key is to track your number over time and understand what’s normal for your business.
So, you’ve calculated your inventory turnover in days. You have a hard number. But that number, on its own, is just data—it doesn’t tell you if you’re doing well or falling behind.
Context is everything. A great turnover rate for a Shopee store selling fast-fashion is going to look completely different from a healthy one for a high-end furniture retailer on WooCommerce. To know what your number actually means, you have to measure it against industry benchmarks.
This comparison is how you figure out where you really stand. Are you keeping pace with your competitors, lagging behind, or leading the pack? The answer is critical for building a smart, effective strategy.
There’s no single “ideal” inventory turnover rate because every industry operates differently. The right number is shaped by things like how long a product stays fresh, how long it takes to make, and how customers buy. A grocery business has to move stock in days, while a company selling heavy machinery might hold onto it for months.
Here are a few of the main reasons for these huge variations:
This infographic gives you a quick visual for interpreting your turnover days, showing everything from the lightning-fast rocket to the slow-and-steady snail.
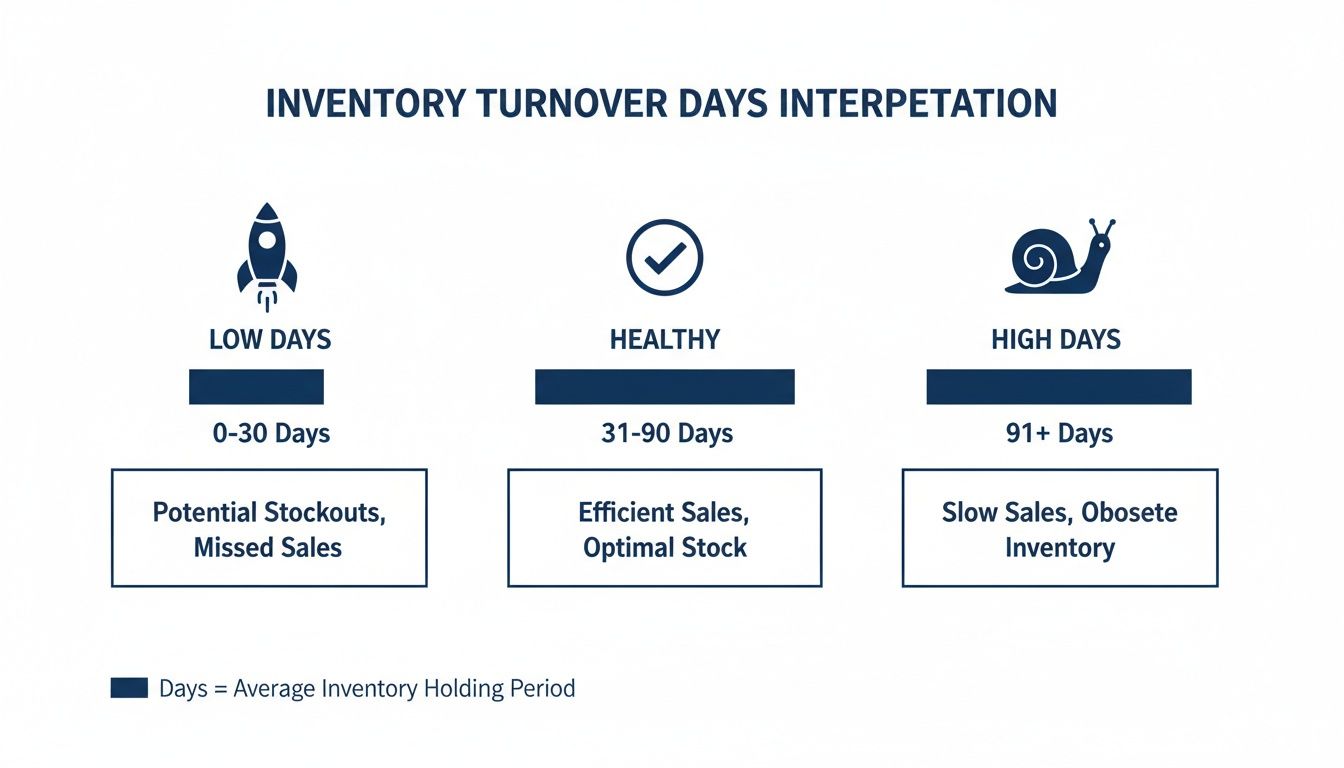
Think of this as your at-a-glance guide. It helps you instantly see whether your inventory velocity is driving growth or just tying up your cash.
Understanding these industry nuances is vital, especially if you sell a wide range of products. You can’t hold a slow-moving, high-margin item to the same standard as a fast-selling, low-margin one. By looking at benchmarks, you can set meaningful targets for different product categories and sales channels.
Recent data paints a clear picture of just how much these numbers can vary. In 2024, the average inventory turnover across all sectors was about 43 days. But for retail—a key space for ecommerce sellers—it was a much quicker 32 days, while technology retail sat closer to 47 days.
For multi-channel merchants using a tool like OneCart to manage sales across Shopify, Lazada, and TikTok Shop, aiming for a turnover below the general retail average is a solid goal. It helps you cut down on holding costs and avoid the risk of overselling popular items. You can find more insights on global inventory benchmarks at UnleashedSoftware.com.
Benchmarking lets you set specific, data-backed goals. For example, if the industry average is 45 days and yours is 65, you can create a clear plan to cut that down by 20 days next quarter by focusing on your slowest-moving SKUs.
This is how benchmarking transforms from a simple comparison into a powerful tool for growth. It lets you pinpoint which parts of your inventory are dragging you down and focus your energy where it will make the biggest difference to your cash flow and bottom line.
Knowing your inventory turnover ratio in days is the first step. The next, and more important one, is taking action to improve it. A lower number means better cash flow and healthier profits, so even small, consistent improvements can have a huge impact on your bottom line.
The most effective way to tackle this is with a two-pronged attack: refining your internal operations and boosting your external marketing. By focusing on both how you manage stock and how you sell it, you create a powerful system for moving products more efficiently.
Improving your turnover starts behind the scenes, long before a customer even thinks about clicking “buy.” Tuning your operational processes ensures you have the right amount of stock at the right time, cutting down the risk of products just sitting on a shelf collecting dust.
1. Sharpen Your Demand Forecasting
Relying on past sales data alone is like driving by only looking in the rearview mirror. True forecasting needs to look ahead, incorporating real-time signals to predict what customers will want next.
2. Strengthen Supplier Relationships
The time it takes for new stock to arrive—your lead time—directly impacts how much inventory you’re forced to hold. Long and unpredictable lead times mean you have to keep more safety stock on hand, which is a direct hit to your turnover rate.
3. Optimize Your Fulfillment and Shipping
How fast and reliably you can get orders to your customers also influences turnover. Quicker shipping leads to happier customers and reduces the time your inventory is tied up in that “shipped but not delivered” limbo. Especially for online businesses, choosing a reliable logistics partner is a concrete step you can take to ensure speedy deliveries, which in turn helps your turnover.
Once your operations are humming along, the next move is to use smart marketing tactics to speed up how quickly products move off your digital shelves. This is especially vital for clearing out those items that are dragging down your overall turnover ratio.
1. Create Strategic Product Bundles
Bundling is a classic for a reason: it works. It increases the perceived value for the customer while helping you offload slow-moving inventory alongside your bestsellers.
2. Run Targeted Flash Sales and Promotions
Flash sales create a sense of urgency that can drive a massive spike in sales over a very short period. This is an incredibly powerful tool for clearing out seasonal or aging stock before it becomes a total loss.
3. Optimize Your Product Listings
Think of your product page as your digital salesperson. A poorly optimized listing can completely kill a product’s sales velocity, leaving it to sit on the shelf and wreck your turnover numbers.
For any brand selling across multiple channels, your inventory turnover ratio in days is only as good as the data you feed it. Juggling sales across Shopee, Lazada, and your own Shopify store means your information is scattered everywhere. This makes getting a clean, real-time snapshot of your stock levels or sales speed nearly impossible.
Imagine trying to calculate your average inventory by wrestling with three different spreadsheets. By the time you’ve merged the numbers, they’re already out of date. This kind of disconnected, manual work leads to wonky calculations and decisions that are always one step behind.
This is exactly the problem that a centralized platform is built to solve. By pulling all your sales channels into a single, unified dashboard, you get one single source of truth for your entire operation—in real time.
When your inventory data is unified, the numbers you need to calculate your turnover are always accurate and ready to go. No more guesswork, no more frantic data entry.
A centralized system gives you the clean, reliable data needed for a precise inventory turnover ratio in days calculation. This accuracy means you can actually trust the metric and use it to make confident calls on purchasing, marketing, and pricing.
For instance, when an order flies in from Lazada, a platform like OneCart instantly updates the stock level across your Shopify and Shopee stores in seconds. This puts a stop to overselling and guarantees the inventory figures in your reports reflect what’s actually on your shelves right now.
But just having accurate numbers isn’t the whole story. A modern centralized system also gives you the tools to act on them. Built-in analytics can automatically flag the slow-moving products that are secretly dragging down your turnover rate.
Instead of digging through reports yourself, you get alerts pointing you straight to the SKUs that have been gathering dust. This lets you get ahead of the problem.
Here’s how that plays out in the real world:
The last few years have shown just how dangerous siloed data can be, with many ecommerce brands watching their average turnover time creep past 60 days thanks to supply chain chaos and poor forecasting. As detailed analyses of industry KPIs show, businesses that use multi-channel platforms to centralize orders can improve their turnover by 20-30%. You can explore more about these inventory turnover trends on ShipBob.com.
By unifying your data, you turn your inventory turnover ratio in days from a boring, static number into a dynamic tool for growth. To see how these processes are streamlined, you can learn more about an inventory management system for Singapore. This approach makes sure you’re always making data-backed decisions that keep your inventory lean, your cash flow healthy, and your business ahead of the competition.
Got questions? You’re not the only one. Even with the formulas down, practical questions always pop up when you start applying the inventory turnover ratio in days to your own shop.
Let’s clear up some of the most common queries we hear from ecommerce sellers.
For a brand-new store, aiming for a turnover between 30 and 60 days is a solid starting point. It’s completely normal for your initial numbers to be higher as you build sales momentum and get your brand out there.
The most important thing for a new business is to watch the trend. Is your number of days steadily dropping month after month? A downward trend is a powerful sign that you’re getting more efficient and finding your market. Use this early data to make smaller, more frequent reordering decisions to avoid tying up precious cash in products that haven’t proven themselves yet.
You should absolutely do both. Each calculation gives you a different, equally valuable perspective on your business’s health.
A store-wide calculation is your high-level snapshot. It tells you about your business’s overall cash flow and operational efficiency. But a good overall ratio can sometimes hide serious problems at the product level.
The most actionable insights come from crunching the numbers for individual products, brands, or categories. This is how you spot your winners that might need faster restocking and your losers that are quietly draining your bank account. It’s how you find the slow-moving items that have been collecting dust for months, even when your overall numbers look great.
For most ecommerce businesses, a monthly calculation strikes the perfect balance. It’s frequent enough to help you spot developing trends and fix issues before they become major headaches, but not so often that you get lost in tiny daily fluctuations.
There are exceptions, of course. If you sell very fast-moving consumer goods or are gearing up for a massive sales event like 11.11, switching to a weekly check-in is a smart move. This lets you make sure you have enough stock to meet the coming surge in demand without overcommitting and getting stuck with a mountain of excess inventory afterward.
Ready to stop juggling spreadsheets and start making data-driven decisions? OneCart centralizes your inventory from Shopee, Lazada, and Shopify into a single dashboard, giving you the real-time accuracy you need to optimize your inventory turnover and boost your bottom line. Take control of your stock and unlock your store’s full potential by visiting https://www.getonecart.com.
Automate & Scale Your Online Business with OneCart
Start a Free TrialUsed by hundreds of merchants in Singapore & Southeast Asia