Unlocking Your Inventory Turnover Days [2025]
Master inventory turnover days with a clear guide. Learn the formula, see real-world examples, and get actionable strategies to improve stock efficiency.
Master inventory turnover days with a clear guide. Learn the formula, see real-world examples, and get actionable strategies to improve stock efficiency.
Inventory turnover days is a metric that tells you, on average, how many days it takes for your business to sell its entire stock.
Think of it like the fresh ingredients in a restaurant’s kitchen. Inventory turnover days shows how quickly you use up all those ingredients to serve dishes before needing to restock.
A low number means you’re running a busy kitchen, selling dishes quickly while ingredients are fresh. A high number suggests produce is sitting on the shelves, tying up cash and risking spoilage.

This metric, sometimes called Days Sales of Inventory (DSI), is a vital health check for any business holding stock. It converts your inventory turnover ratio into a tangible number of days, making it much easier to grasp how fast you’re turning products into cash.
Ultimately, this number directly impacts your cash flow, storage costs, and business agility. Every day an item sits unsold, it represents frozen capital—money you can’t use for marketing, launching new products, or paying bills.
Keeping a close eye on your inventory turnover days helps you make smarter, more profitable decisions. It provides clear answers to critical operational questions.
For instance, if you notice your turnover days are increasing, that’s a significant warning. It strongly suggests you might be overstocking certain items or that some products are losing popularity with your customers.
This insight allows you to address problems before they become serious financial drains. By tracking this number, you can:
Practical Example: An online store selling handmade candles calculates its inventory turnover days to be 95 days. This means, on average, it takes over three months to sell its entire stock. This high figure alerts the owner that too much cash is locked up in slow-moving scents, prompting them to launch a clearance sale to free up capital for new, better-selling products.
Monitoring your inventory turnover days is about gaining the operational clarity you need to keep your business lean, responsive, and profitable.
To make this even clearer, here’s a simple breakdown of what different levels of inventory turnover days might signal about your business’s health.
| Metric Level | What It Means for Your Business | Potential Business Impact |
|---|---|---|
| Low Turnover Days | Your inventory is selling quickly. You have strong sales, efficient operations, or potentially both. | Positive: Excellent cash flow, reduced holding costs, and lower risk of stock obsolescence. Caution: Could indicate you’re under-stocking and at risk of stockouts, leading to lost sales. |
| High Turnover Days | Your inventory is sitting on the shelves for a long time. This could be due to weak sales, overstocking, or poor product demand. | Negative: Cash is tied up in unsold stock, leading to poor liquidity. Higher holding costs (storage, insurance). Increased risk of products becoming outdated or expiring. |
This table helps put the numbers into context. A “good” number depends on your industry, but the goal is always to find the balance between selling efficiently and avoiding stockouts.
Let’s break down the math behind this metric. It’s a straightforward, two-part process. First, you’ll figure out your Inventory Turnover Ratio, and then you simply convert that number into days.
The formulas themselves are simple, but their power is in the clear view they provide of your operations. Getting comfortable with these calculations is the first step to making smarter decisions about your stock. For a deeper dive, you can explore the complete inventory turnover formula and its variations.
Here’s how you can run the numbers for your own business.
Calculate Your Inventory Turnover Ratio: This tells you how many times you sell through your entire stock in a given period (usually a year). The formula is:
Calculate Your Inventory Turnover Days: This turns the ratio into the average number of days it takes for you to sell your inventory. The formula is:
Actionable Insight: Always use the Cost of Goods Sold (COGS) instead of revenue for this calculation. Your inventory is valued at cost, so comparing it to COGS gives you an accurate measure of how efficiently you’re moving products. Using revenue would inflate the figure and provide a misleading view of your performance.
Let’s imagine a fast-fashion brand wants to review its performance over the last year.
First, they calculate their Inventory Turnover Ratio: $800,000 (COGS) / $100,000 (Average Inventory) = 8
This means the brand sold and replaced its entire inventory 8 times during the year.
Next, they convert this into Inventory Turnover Days: 365 / 8 = 45.6 days
It takes this brand roughly 46 days to turn its stock into sales. In the fast-moving world of fashion, this is a healthy number. It shows products are selling well before trends have a chance to fade.
Now, let’s look at an online store that sells high-value consumer electronics.
They start by calculating their Inventory Turnover Ratio: $1,500,000 (COGS) / $500,000 (Average Inventory) = 3
This store turns over its entire inventory just 3 times a year.
Finally, they calculate their Inventory Turnover Days: 365 / 3 = 121.7 days
It takes this business about 122 days—a full four months—to sell through its stock. This is a potential warning sign in the electronics world, where new models make old ones obsolete quickly. It suggests they might be overstocked or holding onto items that are no longer in demand.
To see how other calculations are vital for business health, you can explore this guide on essential inventory management formulas that impact all sorts of operational decisions.
So, you’ve calculated your inventory turnover days. The big question now is: is that number good?
There’s no single correct number. A “healthy” figure changes dramatically depending on what you sell, because different industries have vastly different sales cycles.
For example, a business selling fast-moving consumer goods (FMCG) like snacks or toiletries needs to sell its stock quickly, usually within weeks. On the other hand, a furniture store selling big-ticket, durable items will naturally have a much longer cycle, sometimes taking months to sell a single sofa. Comparing a grocery store to a car dealership doesn’t provide useful insight.
The key is to measure your performance against businesses similar to yours. This gives you a realistic baseline and helps you set achievable goals for lowering your own inventory turnover days.
This flow chart breaks down the simple two-step process to get your final inventory turnover days figure.
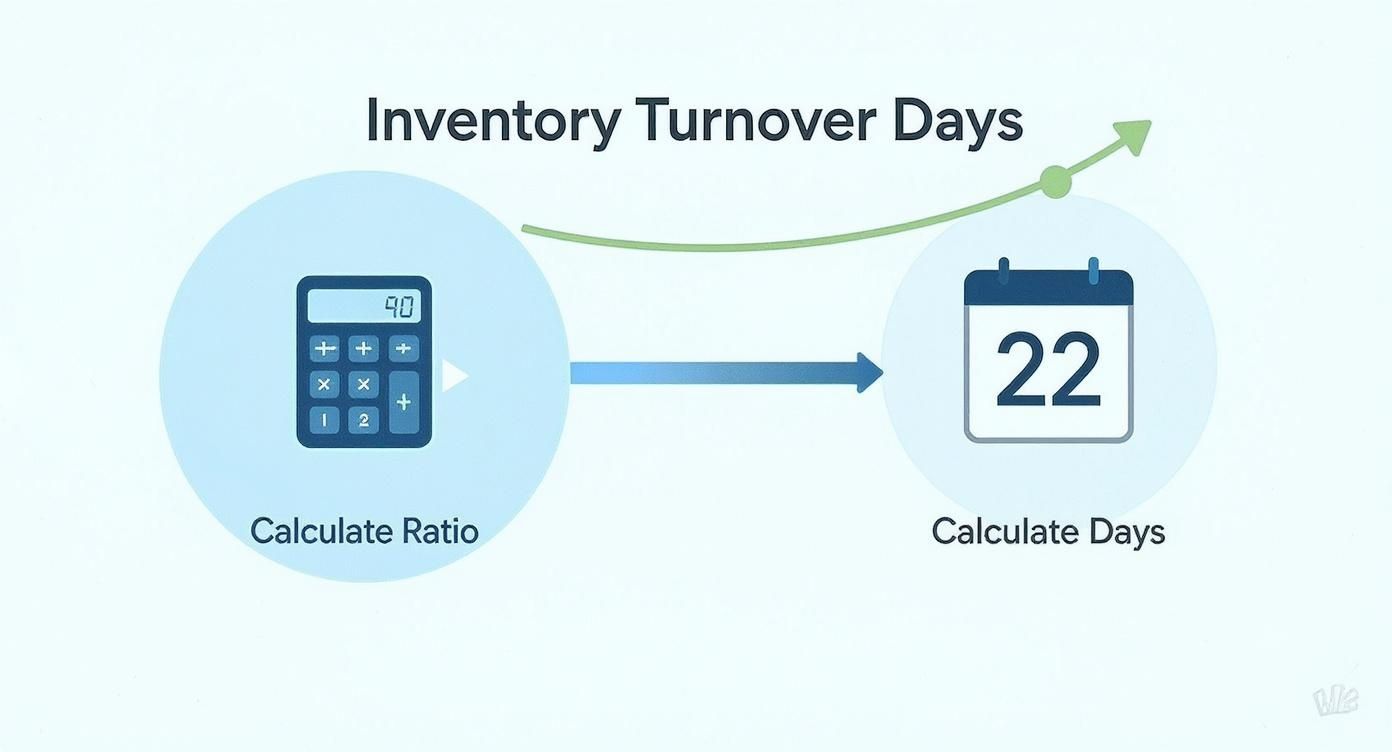
As you can see, you first need to work out your turnover ratio before you can translate it into a tangible number of days.
To put this all into perspective, let’s look at some typical benchmarks for online sellers. While a low number of inventory turnover days is almost always better, what counts as “low” really depends on your niche.
Here are some general guidelines:
Practical Example: Singapore’s Sheng Siong Group, a major supermarket chain, recently reported an inventory turnover that works out to roughly 67 days. This figure reflects the efficient, stable supply chain needed to succeed in the competitive grocery market.
Understanding these benchmarks is just one piece of the puzzle. To get a complete picture of your business’s health, you need to track this metric alongside other top e-commerce metrics and KPIs for business success.
Knowing your inventory turnover days is the first step. The real value comes when you take action to bring that number down. Improving this metric is about making smarter, data-driven decisions that free up your cash and increase profitability.
Here are five practical strategies you can implement to reduce your inventory turnover days and improve your operations.
Accurate forecasting is your first line of defense against overstocking. While looking at past sales data is useful, you also need to consider a wider range of factors.
Start by analyzing seasonal trends, upcoming holidays, and your marketing calendar. If you have a big promotion planned for a specific product, that should influence how much of it you order.
Safety stock is the buffer you keep on hand to avoid stockouts. Too much of it can negatively affect your turnover rate, as every extra unit is capital sitting idle on a shelf.
Calculate safety stock for each product individually instead of applying a one-size-fits-all rule. High-demand items from a reliable supplier need a much smaller buffer than a product with unpredictable sales and long shipping times.
Practical Example: A store sells two phone cases. Case A is a steady seller (100 units/week) and the supplier delivers consistently in 1 week. Case B has erratic sales (20-80 units/week) and a supplier with a 2-4 week lead time. It is wise to hold minimal safety stock for Case A but a much larger buffer for Case B to guard against sales spikes and potential supplier delays.
If some products are starting to sit too long, don’t let them become dead weight. Strategic promotions are a fantastic way to clear out slow-moving inventory and generate cash flow.
A great tactic is to create product bundles. Try pairing a slow-moving item with one of your bestsellers. This can help you move stubborn stock without resorting to deep, brand-damaging discounts.
Not all of your products are equally valuable. SKU rationalization is the process of reviewing your product list and cutting the items that aren’t performing well.
Look at both sales volume and profit margins. A product might sell a decent amount, but if its margin is thin and it takes up valuable warehouse space, it might be time to discontinue it. This frees up your capital to invest in products that drive your business forward. Adopting strategies like Just-In-Time (JIT) delivery can also help minimize how much stock you hold.
A strong, collaborative relationship with your suppliers can be a significant competitive advantage. Good communication can lead to more flexible ordering terms, like smaller minimum order quantities (MOQs) or faster lead times.
When you can order more frequently in smaller batches, you drastically reduce the amount of inventory you need to keep on hand. This “just-in-time” style of inventory management is one of the most direct ways to lower your inventory turnover days.

Trying to manage all these strategies manually can be challenging, especially when selling across multiple online channels. Modern inventory management systems are essential for any e-commerce business that wants to scale.
The right technology addresses the root causes of high inventory turnover days. Instead of relying on guesswork and spreadsheets, these platforms provide a single, reliable source of truth for your stock levels, sales data, and ordering. This allows you to shift from manual tracking to automated control, making your inventory work for you.
One of the biggest challenges for multi-channel sellers is knowing what you have in stock at any given moment. When your inventory levels aren’t synced in real-time between Shopee, Lazada, and your own Shopify store, you risk overselling your most popular items.
This leads to cancelled orders, frustrated customers, and a negative impact on your brand. A centralized system like OneCart solves this by instantly updating your stock levels across every channel the second a sale is made.
Actionable Insight: With real-time sync, you can confidently list all your available stock on every channel. This increases your sales potential without the fear of overselling, helping you turn inventory faster simply because more shoppers can see it.
Accurate demand forecasting is critical for lowering inventory turnover days, but it’s nearly impossible without clean, accessible data. Modern platforms have built-in analytics that turn your sales history into clear insights for smarter buying decisions.
These tools can help you:
When you base your purchasing on actual data instead of a gut feeling, you dramatically reduce the risk of overstocking and keep your inventory lean. A perpetual inventory system is a fantastic way to manage this data flow, giving you continuous, up-to-the-minute tracking of stock levels.
Manually tracking when to reorder thousands of different SKUs can lead to errors. You either order too soon and bloat your inventory, or you order too late and face costly stockouts.
Automated reordering workflows remove the guesswork. You can set up custom low-stock alerts and reorder points for each product, tailored to its sales speed and supplier lead times. The system then automatically notifies you or even creates purchase orders when stock hits a critical level, ensuring you maintain optimal inventory levels without constant monitoring.
As you start working with this metric, a few questions often arise. Understanding these will help you use inventory turnover days more effectively and avoid common mistakes when making business decisions.
Here are straightforward answers to the questions we hear most often.
Yes, absolutely. While a low number usually signals strong sales efficiency, an extremely low figure can be a warning sign. Imagine a popular cafe that runs out of croissants by 9 AM—they sold out, but they also have disappointed customers who might go elsewhere tomorrow.
An unusually low number often means you’re carrying too little inventory. This leads to stockouts, resulting in lost sales and unhappy customers. It could also mean you’re placing many small, frequent orders, which can increase your shipping and administrative costs.
Actionable Insight: The goal is to find a balance where stock moves quickly, but not so fast that you can’t keep up with customer demand. Always analyze your stockout rate alongside your inventory turnover days to get the complete picture.
Always use the Cost of Goods Sold (COGS) for an accurate result.
Your inventory is valued on your books at its cost, not its selling price. To get a true comparison of how efficiently you’re moving stock, you must compare it to COGS, which is also a cost-based figure.
Using sales revenue would distort the calculation because revenue includes your profit margin. It would make it appear as if you’re selling inventory much faster than you really are, leading to flawed purchasing and promotion decisions.
The best frequency depends on your business and industry.
If you’re in a fast-moving space like fashion or consumer electronics, measuring monthly or even weekly is a smart move. This gives you timely data to react to market shifts and avoid getting stuck with outdated products.
The most important thing is consistency. Pick a timeframe that makes sense for your business and stick to it. Consistent measurement is the only way to spot trends over time and determine if your inventory strategies are effective.
Ready to stop guessing and start optimising? OneCart brings your inventory from Shopee, Lazada, TikTok Shop, Shopify, and more into one central hub. You get the real-time data and automated workflows needed to shrink your inventory turnover days and put an end to costly overselling. Explore how OneCart can make your inventory work smarter for you.
Automate & Scale Your Online Business with OneCart
Start a Free TrialUsed by hundreds of merchants in Singapore & Southeast Asia