Discover how to find margin: A proven guide for ecommerce 2026
Learn how to find margin with actionable steps to boost your ecommerce profits. Get cost analysis, pricing formulas, and tips for Shopify, Shopee, and Lazada.
Learn how to find margin with actionable steps to boost your ecommerce profits. Get cost analysis, pricing formulas, and tips for Shopify, Shopee, and Lazada.
Finding your profit margin boils down to a simple idea: Revenue - Costs = Profit. It sounds easy enough. But for any multi-channel seller, the real trick is knowing what counts as a “cost.”
The truth is, dozens of tiny expenses—from hidden marketplace fees to shipping and marketing—are constantly eating into every sale you make.
It’s a classic trap for sellers juggling orders across Shopee, Lazada, and Shopify. The notifications are buzzing, and your sales charts are climbing. Everything feels great. But when you check your bank account at the end of the month, the numbers just don’t add up.
This gap between impressive sales and disappointing profit is where so many promising e-commerce businesses get stuck. The key to building a sustainable business is about understanding how much you actually keep.
I’ve seen it happen time and again. A busy seller sees their daily order volume climbing and assumes the business is thriving. In reality, razor-thin margins on their most popular products, combined with rising platform fees and ad spend, are quietly draining their cash flow. They’re mistaking revenue for profit—a critical error that can push a business to the brink before the owner even realizes what’s happening.
Learning how to find your margin is about getting financial clarity. It’s the one metric that tells you if your business model is actually working. You can focus on these three core types of margin to get the insights you need:
In the fast-paced world of multi-channel e-commerce, mastering these calculations is non-negotiable. Global eCommerce sales are projected to hit a staggering $6.86 trillion in 2025. But behind that massive number, the average net profit margins often hover around a slim 5-10% after marketing, shipping, and fees take their cut.
The businesses that consistently achieve sustainable 20-40% margins are the ones who have learned to turn their sales data into a scalable growth strategy.
You can dig deeper into these e-commerce statistics to see how top sellers protect their profitability. This guide will give you the tools to do the exact same thing.
To really get a grip on your business’s financial health, you have to look past total sales. Profit margin calculations cut through the noise, showing you exactly what you earn from each transaction. These are essential tools for making smart decisions about your products, pricing, and marketing channels.
This simple flowchart lays out the fundamental path to profit.
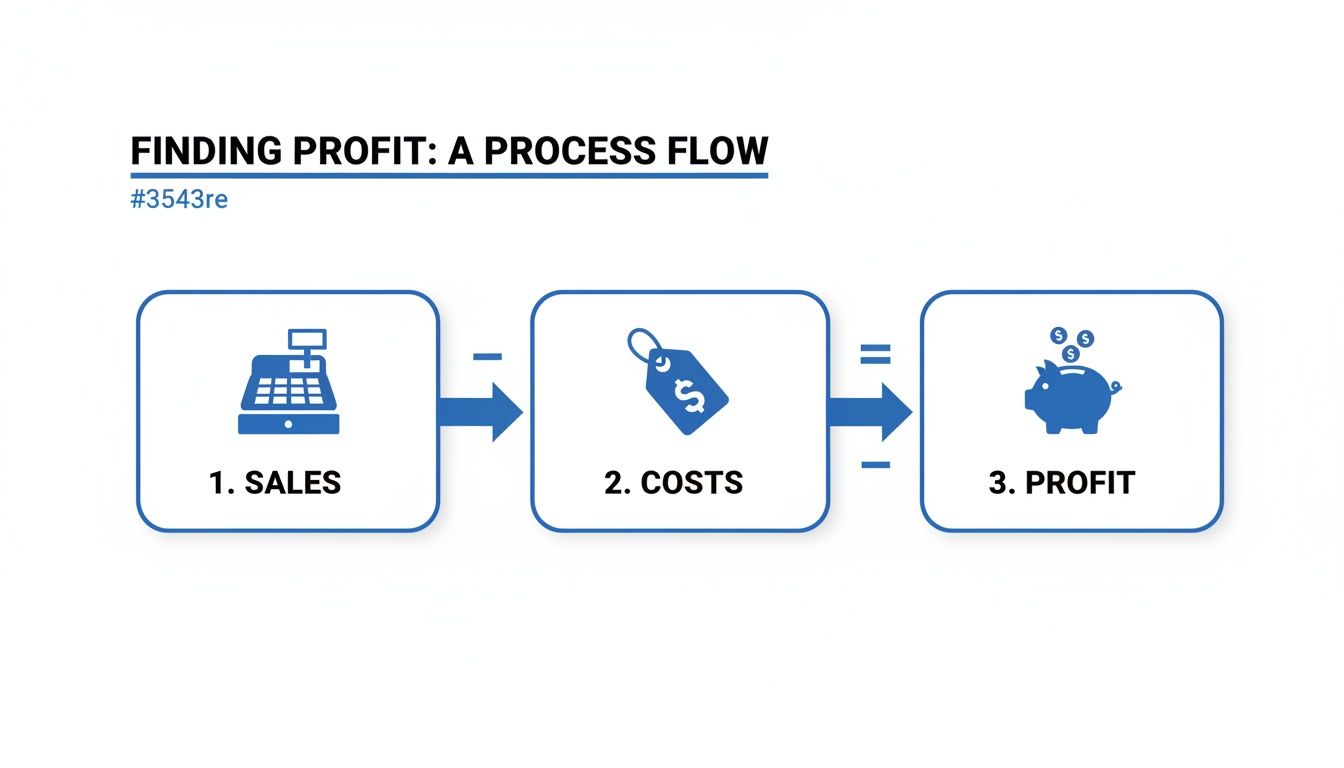
It all boils down to a simple truth: start with your sales, subtract all the costs that went into making that sale, and what’s left is your profit.
Let’s break down the only three margin formulas you need to master. We’ll use a practical example throughout: a custom-printed t-shirt that you sell for $25.
First up is Gross Profit Margin. Think of this as your most basic profitability check. It answers one simple question: after I pay for the direct costs of making my product, is there any money left? This tells you if a product is viable at its most fundamental level.
The formula is pretty straightforward:
Gross Profit Margin = (Revenue - Cost of Goods Sold) / Revenue
Practical Example: The T-Shirt Let’s say your printed t-shirt sells for $25. The blank shirt, the printing, and the tag cost you a total of $10. This $10 is your Cost of Goods Sold (COGS).
Actionable Insight: A 60% gross margin means that for every dollar you make in sales, you have 60 cents left over to cover all your other business expenses. If this number is low or negative, you either need to raise your price or find a cheaper supplier for the shirt. If you’re looking for more detail on the difference between the dollar amount and the percentage, our guide on gross margin vs. gross profit breaks it down.
Next, we have Contribution Margin. This one goes a step further by including all the variable costs that come with a sale—not just the COGS. These are the costs that change with every single order, like marketplace fees, shipping, and the ad spend that drove that specific purchase.
This metric is vital for multi-channel sellers because it shows if a particular sale is actually contributing cash to pay your fixed overhead costs, like rent and salaries.
Contribution Margin = (Revenue - Total Variable Costs) / Revenue
Practical Example: Selling the T-Shirt on a Marketplace You sold the same $25 t-shirt, and the COGS is still $10. But now, let’s add on the other costs tied to this specific sale:
Your total variable costs are now $10 + $3.75 + $4.00 + $2.00 = $19.75.
Actionable Insight: This tells a very different story. After all the variable costs are paid, each t-shirt sale contributes just 21% of its revenue toward covering your fixed business expenses. If you run a promotion that increases ad spend, you can use this formula to see if the extra sales are actually improving your overall profit.
Finally, the Net Profit Margin is the ultimate health score for your entire business. It calculates your profit after all expenses—both variable and fixed—are deducted from your revenue. This is the “bottom line” that shows what percentage of your total sales is pure, take-home profit.
Net Profit Margin = (Total Revenue - Total Expenses) / Total Revenue
Practical Example: The T-Shirt Business for the Month Let’s zoom out. Imagine in one month you sold 1,000 t-shirts, generating $25,000 in revenue.
Your total expenses are $19,750 + $3,000 = $22,750.
Actionable Insight: A 9% net margin means your business is profitable, but it also shows just how quickly fixed and variable costs can chew through your revenue. Tracking this number monthly helps you see if your efforts to reduce costs or increase prices are actually improving your bottom line. For a deeper look at your business’s overall profitability, you can follow this step-by-step guide on how to calculate profit margins.
Here’s a quick cheat sheet to keep these formulas straight.
This table gives you a simple, at-a-glance summary of the three key margin formulas and when to use them.
| Margin Type | Formula | What It Tells You |
|---|---|---|
| Gross Margin | (Revenue - COGS) / Revenue | Is this product profitable at the most basic level? Use this to check product viability. |
| Contribution Margin | (Revenue - Total Variable Costs) / Revenue | Is this specific sale helping to cover my fixed costs? Use this to analyze channel and ad performance. |
| Net Margin | (Revenue - Total Expenses) / Revenue | Is my entire business profitable? Use this for a monthly or quarterly health check. |
Mastering these three calculations moves you from just selling products to building a truly profitable and sustainable e-commerce business.
Gross profit margin tells you if a product is viable on paper, but profit is often lost in the messy details of selling online. The real challenge in finding your true margin comes from identifying the dozens of small, variable costs that chip away at every single sale you make.
These “hidden” costs are where healthy profits disappear.

These expenses get particularly tricky for multi-channel sellers because they change dramatically from one platform to the next. A sale on your Shopify store has a completely different cost structure than the exact same product sold on Shopee or Lazada.
This is why contribution margin is the most powerful tool for channel-level analysis. It forces you to account for every single fee tied to a specific sale.
To calculate an accurate contribution margin, you need to go far beyond your basic Cost of Goods Sold (COGS). Think of it as a forensic audit of a single transaction. Let’s look at the most common culprits that drain your profits.
These are, without a doubt, the most significant variable costs after COGS. The tricky part is that they are a collection of different charges that can add up shockingly fast.
Actionable Insight: Using a single, estimated percentage for “platform fees” is a common mistake. You absolutely must dig into your seller statements to find the real rates for each channel. They can differ by 5-10% or even more.
Shipping is never as simple as the price you charge the customer. The actual cost to get a product out the door is a major variable expense that needs careful tracking. In my experience, this is an area where many sellers miscalculate their margins badly.
Returns are an unavoidable part of e-commerce, and they come with direct costs that hit your bottom line hard. You have to account for them when calculating your average per-sale profitability.
You simply can’t ignore these seemingly minor expenses if you want to find your true margin. For a comprehensive look at how these costs impact your final numbers, check out our guide on calculating your net sales margin.
Let’s see this in action. Imagine you sell a premium leather wallet.
Now, let’s sell this wallet on two different platforms. We’ll calculate its contribution margin to see which channel is truly more profitable per sale.
Scenario 1: Selling on Your Shopify Store
Contribution Margin Calculation ($50 - $22.75) / $50 = 54.5%
Scenario 2: Selling on a Marketplace (e.g., Shopee/Lazada)
Contribution Margin Calculation ($50 - $24.00) / $50 = 52%
As you can see, the exact same product has a completely different profitability profile depending on where it’s sold. A 2.5% difference in contribution margin might seem small, but scaled across thousands of orders, it represents a massive impact on your overall business health. For warehouse managers expanding from platforms like Shopify to TikTok Shop, the contribution margin formula is king.
While benchmarks for some niches are low, premium products should push for 30-50%. This is a critical target as Southeast Asia’s e-commerce market is projected to grow by 23% in 2025. Discover more insights about global ecommerce trends and statistics. This level of detailed analysis is how you move from just making sales to building real, sustainable wealth.
Understanding your margins is the starting line. The real race is won by taking deliberate, informed actions to improve them. Once you have a clear picture of your per-SKU and per-channel profitability, you can finally stop guessing and start making strategic moves that directly pump up your bottom line.
These are field-tested strategies to help you turn that margin data into actual, tangible growth.
The goal is to surgically enhance profitability where it truly matters. For businesses aiming for scalable growth, the financial oversight of an expert can be invaluable. Many are now leveraging outsourced CFO and accounting services for exactly this kind of strategic optimization.
One of the most powerful things you can do is to kill the “one-price-fits-all” strategy. As we’ve seen, the all-in cost to sell a product can be wildly different between your own Shopify store and a marketplace like Lazada.
Smart pricing embraces these differences.
Start by calculating the contribution margin for your top-selling products on each channel. If you discover a product’s margin on a marketplace is 5-10% lower than on your own site because of higher fees, you’ve just found your first opportunity.
A Practical Example: The Leather Wallet
Actionable Insight: This small tweak directly offsets the higher channel costs, bringing that channel’s profitability back in line without penalizing your direct customers. Most shoppers stick to one platform and won’t be cross-referencing your prices everywhere. The goal is simple: make every sale a profitable one.
Your Cost of Goods Sold (COGS) is almost always your single biggest expense category. That makes it the best target for optimization. Armed with your sales data, you can finally approach your suppliers from a position of strength.
Show them your volume. When you can prove consistent and growing order quantities, you gain serious negotiating power.
Actionable Insight: A mere 5% reduction in COGS can often translate to a 20-30% increase in net profit, depending on your existing margin structure. It’s one of the highest-impact levers you can pull.
Shipping is another area where small, hidden inefficiencies can quietly bleed your margins dry. Fixing this requires a multi-pronged attack that goes way beyond just picking the cheapest carrier.
Actionable Steps for Shipping Optimization:
Every business has them: “zombie” products. They sell once in a while but have razor-thin—or even negative—margins. These SKUs tie up capital in inventory, hog warehouse space, and eat up your time without adding anything meaningful to your profit.
It’s time to get ruthless.
Run a report sorting all your SKUs by contribution margin. Any product falling below a set threshold (say, 15%) needs immediate attention. You have three choices:
Manually calculating margins for every single order isn’t just tedious—it’s completely unsustainable. Once you’re handling over 50 orders a day, trying to track every fee and cost in a spreadsheet becomes a full-time job, and a dangerously error-prone one at that. This is the breaking point where you have to move from manual tracking to an automated solution to protect your profits and scale your business.
Automation is a necessity for growth. Sure, you save a ton of time by getting rid of manual data entry, but the real power comes from having real-time, accurate financial data right at your fingertips. This lets you make smarter, faster decisions on pricing, promotions, and inventory without having to wait for a month-end report.
For sellers just starting out, a spreadsheet feels like the perfect tool to figure out your margins. You set up columns for revenue, COGS, and marketplace fees, and it seems to work. But this system breaks down fast as your business grows and things get more complex.
If you want to get a bit more organized, you could start with a pre-built Google Sheets template. It’s still a manual process, but it gives you the right structure and formulas to track your numbers more consistently than a blank sheet. But for true scalability, you need a dedicated platform.
This is where a system like OneCart completely changes the game. Instead of you chasing down data from different places, the platform does all the heavy lifting for you. It connects directly to all your sales channels—like Shopee, Lazada, and Shopify—and automatically pulls in all the necessary information.
This dashboard view shows you exactly what that looks like. Sales, costs, and profits from different channels are all displayed in one clear, unified view.

This kind of unified view immediately shows you which channels and products are your top performers, letting you make quick, data-backed decisions. A dedicated platform syncs all the critical data points you need for accurate margin calculations, and it does it in real-time.
Actionable Insight: Automation transforms margin calculation from a reactive, historical report into a proactive, strategic tool. It surfaces live insights that empower you to protect and grow your profitability every single day.
Just imagine having a dashboard that automatically calculates your contribution margin for every single SKU, broken down by channel. You could instantly see that a flash sale on one platform is driving high volume but negative margins because of campaign fees, allowing you to tweak your strategy on the fly.
This is the level of control that automation gives you. To see how simple this can be, you can learn more about the process of exporting e-commerce finance data from OneCart. By embracing automation, you free up your most valuable resource—your time—and gain the financial clarity you need to build a truly resilient and profitable e-commerce business.
Once you get the basic formulas down, the real-world questions start popping up. We hear them all the time from sellers trying to connect the numbers on a spreadsheet to the reality of running a multi-channel business.
Let’s clear up some of the most common ones.
There’s no single magic number here. A “good” margin depends entirely on your industry, what you sell, and how your business is set up. But there are some general benchmarks you can aim for.
For many online stores, a gross margin of 30-50% and a net margin of 10-20% are healthy targets.
Of course, it’s not one-size-fits-all:
The most important thing isn’t hitting some universal benchmark. It’s knowing your own numbers, inside and out. Consistently tracking your specific margins is what really tells you if you’re covering all your costs and building a sustainable business.
This is a big one. Your marketing and ad spend are major expenses, and you absolutely have to factor them in to get a true picture of your profitability. The key is knowing where they fit.
When you’re calculating your contribution margin for a specific channel (like your TikTok Shop), you should treat the ad spend for that channel as a variable cost. This tells you if that channel is actually profitable after you account for the direct cost of getting those customers.
For your overall business health, your total marketing and advertising costs get included as part of your operating expenses when calculating your net profit margin. This helps you track your Return on Ad Spend (ROAS) and make much smarter decisions about where your budget is going.
Actionable Insight: By tying ad spend directly to specific sales channels, you can figure out which platforms are bringing you the most profitable customers—not just the most sales.
This is non-negotiable: always calculate your margin based on the final selling price after all discounts and promotions have been applied.
Using the original, non-discounted price will give you a dangerously inflated and completely inaccurate view of your profitability. That discounted price is the actual revenue that hits your account for that sale.
Factoring in discounts is the only way to understand the true impact of your promotional strategy. It stops you from running a popular campaign that looks great in your sales report but is secretly bleeding you dry by selling products at a loss. Once you start analyzing your post-discount margins, you can start building smarter, more profitable promotions for the future.
Stop drowning in spreadsheets and start making data-backed decisions. OneCart automates your margin tracking across all your channels, giving you the real-time financial clarity you need to grow your profits. See how OneCart can transform your business today.
Automate & Scale Your Online Business with OneCart
Start a Free TrialUsed by hundreds of merchants in Singapore & Southeast Asia