Master the Formula for Safety Stock and End Stockouts 2026
Stop losing sales to stockouts. Learn the right formula for safety stock to buffer against demand spikes and supplier delays on Shopify, Lazada, and Shopee.
Stop losing sales to stockouts. Learn the right formula for safety stock to buffer against demand spikes and supplier delays on Shopify, Lazada, and Shopee.
A simple way to calculate a basic safety stock buffer is with this formula: (Maximum Daily Sales × Maximum Lead Time) – (Average Daily Sales × Average Lead Time). This gives you a baseline cushion to protect your ecommerce business from sudden sales spikes and supplier delays, helping you avoid painful stockouts.
Think of safety stock as the reserve fuel tank in your car. You don’t plan on using it every day, but it’s an absolute lifesaver when you hit an unexpected traffic jam or find the next petrol station is closed. In ecommerce, this buffer is what protects you from two big uncertainties: sudden surges in customer demand and unpredictable supplier delays.
Getting this number wrong creates expensive problems.
Having too little stock leads to lost sales and can damage your store’s ranking on competitive marketplaces like Shopee, Lazada, and TikTok Shop. But holding too much ties up your cash in warehouse shelves—money that could be spent on marketing or growing your business.
Without a reliable formula, businesses often fall back on guesswork, and that can be a costly habit. The consequences of getting it wrong ripple through your entire operation, hitting everything from customer happiness to your bottom line.
A well-planned buffer helps you strike a strategic balance.
Holding the right amount of safety stock ensures you can meet customer promises without freezing your working capital in products that just aren’t selling. This balance is fundamental to profitable growth.
This is especially true in today’s market. Post-pandemic supply chains across Southeast Asia are still volatile, making a solid inventory strategy essential for navigating unexpected disruptions.
To get a sense of these ongoing challenges, you can read more in a report by the Asian Development Bank.
The table below breaks down the damage caused by having either too little or too much stock.
| Impact Area | Consequences of Stockouts (Too Little Stock) | Consequences of Overstocking (Too Much Stock) |
|---|---|---|
| Sales & Revenue | Lost sales from unavailable products, especially top-sellers. | Cash is tied up in slow-moving inventory, hurting cash flow. |
| Customer Loyalty | Disappointed customers may buy from competitors instead. | Increased holding costs (storage, insurance, obsolescence). |
| Marketplace Rank | Lower seller scores and visibility due to unfulfilled orders. | Risk of products expiring or becoming obsolete. |
| Operational Costs | Higher costs for expedited shipping to restock quickly. | Need for markdowns and clearance sales to free up space. |
| Business Growth | Damaged brand reputation from being unreliable. | Capital that could fund marketing or new products is stuck. |
As you can see, both extremes are bad for business. Finding that sweet spot is where a good safety stock formula comes in.
A clear formula turns inventory management from a guessing game into a science. By using your own historical data, you can build a reliable buffer that’s customised for each product’s unique sales patterns and your supplier’s performance. For a deeper dive into the fundamentals, check out our guide on understanding safety stock and how it prevents stockouts.
This data-driven approach helps you achieve several key goals:

When you’re dealing with products that have consistent sales and reliable suppliers, you can start with a simple but surprisingly effective formula. It’s the perfect entry point for calculating a buffer without getting tangled up in complex statistics.
This approach is ideal for those bread-and-butter items—the ones that sell steadily but aren’t likely to go viral overnight or see crazy seasonal spikes.
The basic formula for safety stock is:
(Maximum Daily Sales × Maximum Lead Time) – (Average Daily Sales × Average Lead Time)
This calculation creates a buffer by measuring the gap between your absolute worst-case scenario and your typical day-to-day operations. It answers a simple but critical question: “How much extra stock do I need if my biggest sales day ever happens right when my supplier takes the longest they’ve ever taken to deliver?”
To make this formula work, you need four key pieces of information pulled straight from your sales and purchasing history. Using real numbers from your business, not just guesses, is crucial, or your entire calculation will be off.
Pulling this info directly from your Shopify analytics or Shopee Seller Centre is the best way to make sure your safety stock is grounded in reality.
Let’s say you run a Shopify store and one of your bestsellers is a particular phone case. You dig into your data from the last three months and find these numbers:
Now, let’s plug these into the formula.
The result is your safety stock. You should aim to have 200 extra phone cases on your shelf as a buffer. This stash will see you through unexpected sales surges and supplier hiccups, keeping your customers happy and your sales flowing.
While this basic formula for safety stock is a fantastic starting point, it really shines with predictable products. If you’re selling items with huge swings in demand or have suppliers who are all over the place, you’ll need a more advanced formula to truly protect your business.
The basic formula is a great starting point for stable, predictable products. But what about that item that suddenly goes viral on TikTok, or sees a massive sales spike during a Lazada flash sale? When customer demand is all over the place, you need a more dynamic formula.
This is where we shift from simple averages to a more statistical approach. We’re essentially going to look at your past sales data, measure how much it typically swings up and down, and build a buffer that can handle those fluctuations.
The formula looks like this:
Safety Stock = Z-score × Standard Deviation of Demand
Let’s break down what these two new parts actually mean for your business.
Think of your service level as an insurance policy against stockouts. It’s a percentage that represents how often you want to have a product in stock when a customer wants to buy it.
A 95% service level, for example, means you’re aiming to meet customer demand 95 out of 100 times. You’re accepting a small, calculated 5% risk of selling out.
The Z-score is simply the statistical number that corresponds to the service level you’ve chosen. A higher service level goal requires a higher Z-score, which naturally leads to holding more safety stock.
Here’s a quick reference table to help you match your desired stock availability with the correct Z-score for your calculations.
| Desired Service Level (%) | Corresponding Z-Score | What This Means for Your Inventory |
|---|---|---|
| 90% | 1.28 | You can meet demand in 9 out of 10 scenarios. |
| 95% | 1.65 | You are protected against stockouts 19 out of 20 times. |
| 98% | 1.96 | A very high buffer for your most critical, best-selling products. |
| 99% | 2.33 | Maximum protection, usually reserved for your absolute A-grade items. |
Picking the right service level is a business decision, not just a math problem. For your most profitable, fast-moving products, aiming for a 95-98% service level is a smart move. For slower-moving or less critical items, 90% might be a more cost-effective choice.
Standard deviation of demand sounds intimidating, but it’s just a way to measure how much your daily sales tend to bounce around the average.
A high standard deviation means your sales are unpredictable and swing wildly—like during a major sales event. A low one means they’re pretty stable and consistent. It gives you a single number to quantify that sales volatility.
This concept isn’t unique to e-commerce. Analysis of Asian equity markets often reveals significant volatility, which mirrors the demand fluctuations online sellers face. Just as investors use strategies to manage market risk, sellers must use statistical tools like standard deviation to manage the financial risks of uncertain demand. You can see more on this in the OECD’s report on Asia’s capital markets.
Let’s put this into practice. Imagine you sell a trending handbag on Lazada. It’s popular, so you want a 95% service level to avoid disappointing customers with an “out of stock” notice. This means you’ll use a Z-score of 1.65.
You pull up your sales data from the past week:
You can pop these numbers into a simple online calculator or use the STDEV.S function in Google Sheets or Excel. Doing so gives you a standard deviation of approximately 14.2 units. This single number captures the volatility of your handbag sales.
Now, let’s plug it all into the formula:
So, you should aim to hold 24 extra handbags just as a buffer. This statistical method gives you a far more accurate safety net than the basic formula because it’s tailored to the product’s real-world sales patterns. To learn more about how this fits into a bigger strategy, check out our guide on demand planning and forecasting to master your supply chain.
So far, we’ve looked at formulas that handle either surprise sales spikes or frustrating supplier delays—but what happens when you’re hit with both at once? This is the reality for many sellers.
If you’re facing the double-whammy of unpredictable customer demand and inconsistent supplier shipping, you need a formula that accounts for total uncertainty. This is a common headache for businesses in Singapore sourcing products internationally, where lead times can get messy thanks to customs, port congestion, or logistics hiccups.
The advanced formula is the industry standard for managing risk in a volatile supply chain. It might look a bit intimidating, but its goal is simple: create a single, precise buffer that protects you from both types of surprises at the same time.
Safety Stock = Z × √[(Avg Lead Time × SD of Demand²) + (Avg Sales² × SD of Lead Time²)]
This formula gives you a far more accurate safety net than the simpler methods. It does demand more data, but the payoff is a huge reduction in the risk of both stockouts and having your cash tied up in overstocks.
Before we run through an example, let’s quickly break down the moving parts of this formula. You’ll recognise most of them, but seeing how they work together is the key.
This flowchart shows how your service level feeds into your Z-score, which then uses standard deviation to build a reliable buffer against those unexpected demand swings.
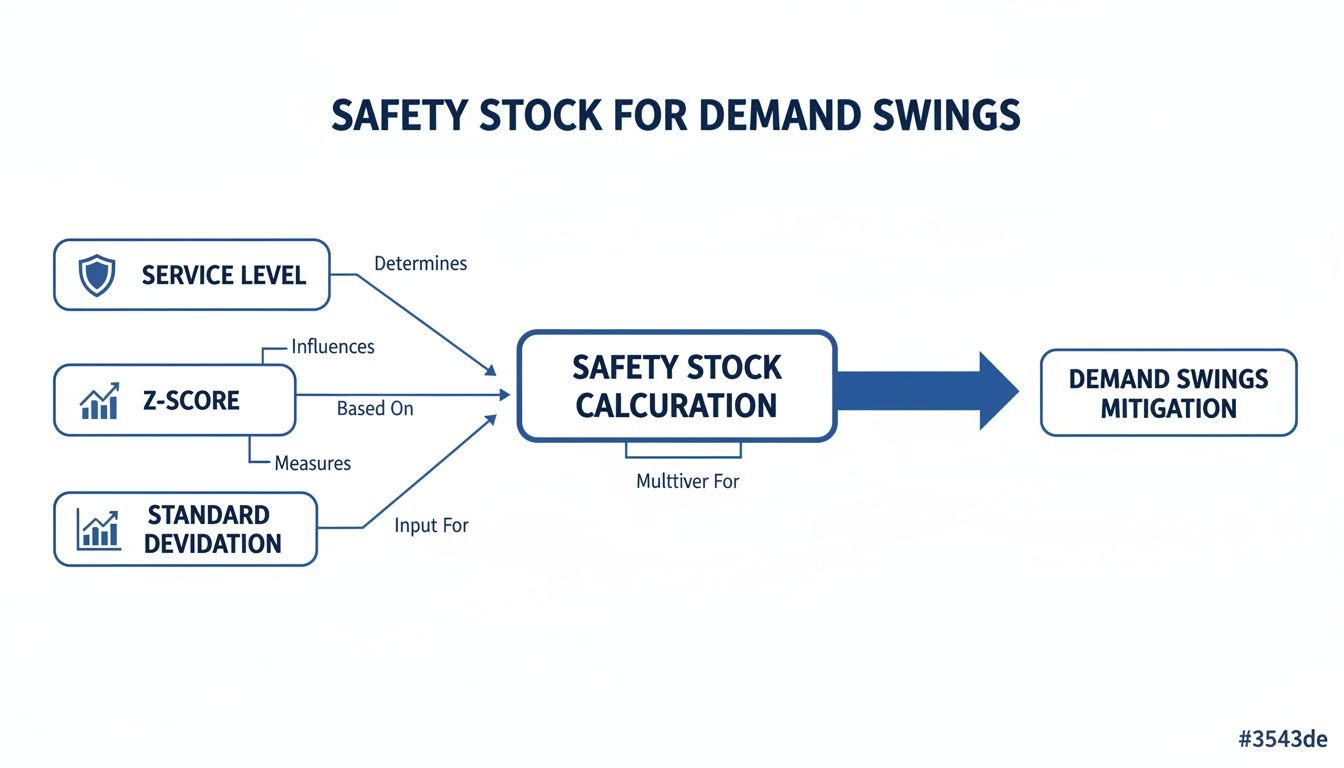
The main takeaway here is that aiming for a higher service level means using a larger Z-score, which naturally increases your safety stock to give you a stronger cushion.
Let’s imagine you sell premium Bluetooth speakers on Shopee, sourced from an overseas supplier. You’re aiming for a 95% service level, which means your Z-score is 1.65. After digging into your sales and supplier data, you come up with these numbers:
Now, let’s walk through the calculation step-by-step to keep things simple.
Step 1: Calculate the Demand Variability
First, let’s figure out the part of the formula that covers unpredictable customer demand.
Step 2: Calculate the Lead Time Variability
Next, we’ll calculate the part that accounts for your supplier’s inconsistent shipping times.
Step 3: Combine Both and Find the Square Root
Now, we add the two results together and find the square root of the total. This gives you the combined uncertainty you’re facing.
Step 4: Multiply by Your Z-Score
Finally, multiply this combined uncertainty figure by your Z-score to get your final safety stock number.
You should hold a safety stock of 209 speakers. This buffer is precisely tuned to shield your Shopee store from both sudden sales spikes and unexpected shipping delays, ensuring you can keep orders flowing even when things don’t go according to plan.

Let’s move from theory to action. This is where these formulas stop being numbers on a page and start protecting your business from stockouts. Knowing how to calculate safety stock is one thing, but efficiently gathering the right data and running the numbers is what turns it into a powerful, day-to-day tool for any ecommerce seller.
The very first step is getting your hands on accurate data. This isn’t about guesswork; it’s about digging into the platforms you already use every day.
Before you can plug numbers into any formula, you need to know exactly where to find them. Here’s a quick checklist to grab the essential data for each of your products:
STDEV.S() function. It will instantly calculate the standard deviation for you.Actionable Insight: Create a simple spreadsheet for each of your key suppliers. Track every single purchase order’s placed date and received date. After just a few orders, you’ll have a clear, data-backed view of their actual lead time and, more importantly, its variability.
Manually calculating these formulas for every single SKU is a recipe for headaches and errors, especially as your catalogue grows. This is where automation becomes a total game-changer.
Modern inventory management software is built to do this heavy lifting for you. By connecting directly to your sales channels like Shopee and Shopify, these systems pull all your sales and purchasing data into one central place.
This means the software can automatically:
Implementing these formulas is a crucial part of broader supply chain management that aims to prevent disruptions and keep your logistics smooth. Automation turns what was a static calculation into a dynamic, responsive strategy. This is especially vital when you’re gearing up for huge sales events like 11.11, as the system can recommend increasing your buffer for key products without you needing to manually crunch the numbers.
This approach also aligns with a growing focus on efficiency in modern supply chains. The increasing attention on ESG (Environmental, Social, and Governance) principles in Southeast Asian markets parallels this shift. Accurate, automated safety stock calculations help minimise waste from overstocking and reduce the carbon footprint from last-minute expedited shipping, fitting perfectly with these sustainable business goals.
The goal is to move beyond static spreadsheets and towards a system that adjusts your safety stock as the market changes. If you’re looking for a tool to help with this, you can experiment with our free safety stock calculator to see how different variables impact your buffer needs.
Even with the right formulas, you’ll run into practical questions the moment you start applying them to your business. Let’s tackle some of the most common ones we hear from sellers.
Getting these details right is what separates a theoretical calculation from a real-world, profit-protecting system.
You should aim to recalculate your safety stock at least quarterly. For your fast-moving or seasonal products, though, monthly recalculations are much better.
If you launch a big marketing campaign or see a new trend taking off, it’s smart to review your numbers immediately. Using inventory management software automates this by constantly analysing real-time sales data, which allows for far more dynamic and accurate adjustments.
The right service level depends entirely on the product. Use a tiered approach rather than one number for everything.
Analyse your product margins and sales velocity to make an informed decision for each SKU. This tiered approach ensures you invest your capital where it delivers the biggest returns.
The goal is strategic protection. You want maximum coverage for the products that actually drive your business, and you’re willing to accept a slightly higher, calculated risk on the items that contribute less to your bottom line.
Inconsistent lead times are exactly why the advanced safety stock formula is so valuable—it’s designed to factor in that very problem. If your supplier’s delivery schedule is all over the place, that formula is your best tool.
Start by meticulously tracking the placement and arrival dates for every single order to get accurate data. If one supplier is consistently unreliable, use a higher safety stock for their products while you start looking for alternatives.
Sometimes, just talking to them helps. Ask your supplier for delivery forecasts and shipping updates. This simple step can give you the visibility needed to tighten your lead time estimates and reduce how much buffer stock you need to carry.
Ready to stop guessing and start calculating? OneCart brings your sales and purchasing data from Shopee, Lazada, and Shopify into one place, making it easy to gather the numbers you need for accurate safety stock calculations. Stop overselling and optimise your capital by automating your inventory management. Learn more and get started at https://www.getonecart.com.
Automate & Scale Your Online Business with OneCart
Start a Free TrialUsed by hundreds of merchants in Singapore & Southeast Asia